
Voters Reflect on America’s Founding Ideals
With all the fanfare surrounding America’s 250th birthday, we wanted to know how voters think about the Declaration of Independence and whether they believe the country is living up to the ideals it sets out.
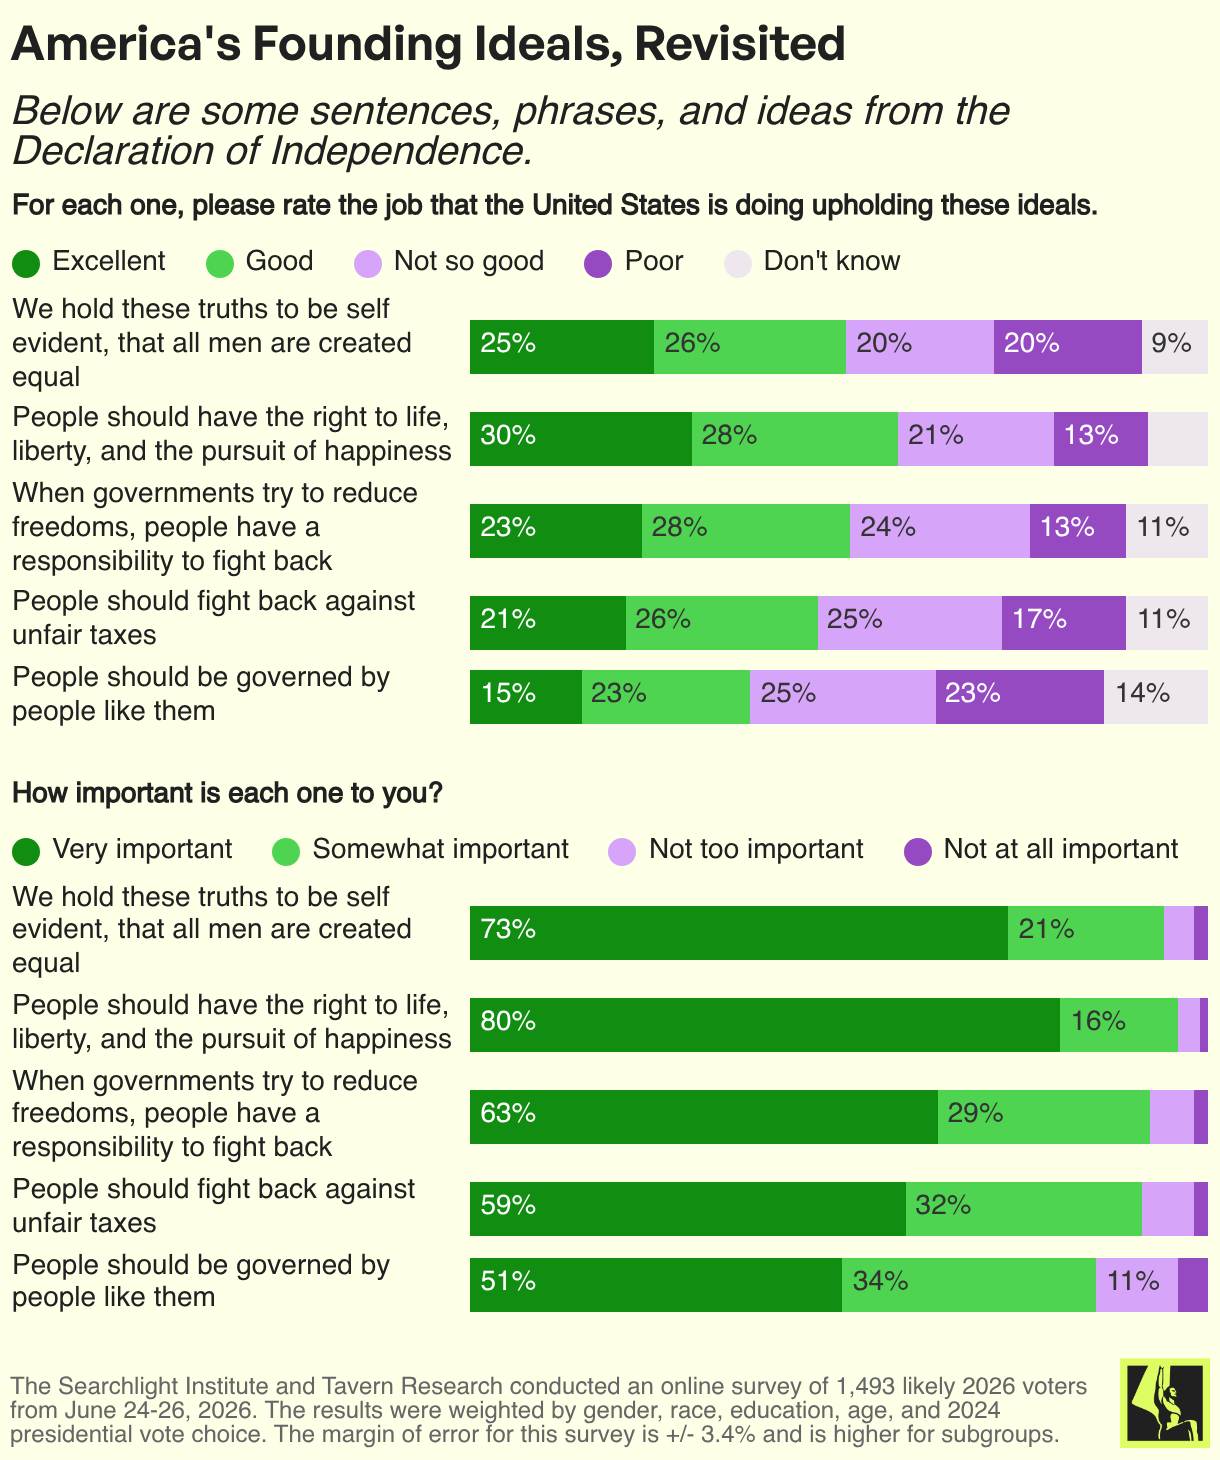
Voters overwhelmingly agree that the ideals in the Declaration of Independence matter to them. Every measure we tested drew majority agreement that it is ‘very important,’ with little difference across party lines. Eighty percent of voters overall, including 82% of Democrats and 78% of Republicans, say it is very important that people have the right to life, liberty, and the pursuit of happiness. Agreement is similarly broad for “We hold these truths to be self-evident, that all men are created equal” (73% overall / 78% Democrat / 68% Republican).
But agreement on principle doesn’t translate into agreement on performance. Across party, age, race, and education, voters are far more divided on whether the country is actually living up to these ideals. The best-rated measure is the right to life, liberty, and the pursuit of happiness, with 58% rating the U.S. excellent or good. However, that positive view is far more common among older voters (65% voters 65+) than younger ones (45% voters 18-34).
Partisan and generational splits also show up on the ideal that “all men are created equal.” Just 18% of voters under 35 rate the country’s performance ‘excellent,’ compared to 32% of voters 65 and older. Republicans are likewise more positive than Democrats or Independents, with 30% giving the U.S. an excellent rating versus 25% of Democrats and 19% of Independents.
Of all the ideals we tested, there is only one where negative ratings outnumber positive ones: ‘people should be governed by people like them.’ Forty-eight percent of Americans rate the country’s performance ‘not so good’ or ‘poor’ on this measure, compared to 38% who rate it ‘excellent’ or ‘good.’ White voters are less likely to rate the U.S.’s performance on this measure positively (36% positive) than Black (40%) or Hispanic (43%) voters. Taken together, these opinions suggest that there is widespread respect for the Declaration of Independence, and the values for governance that it outlines, but that the country is falling short of these ideals. Notably, it is the liberal promise of representative government that is seen as the most out of reach.
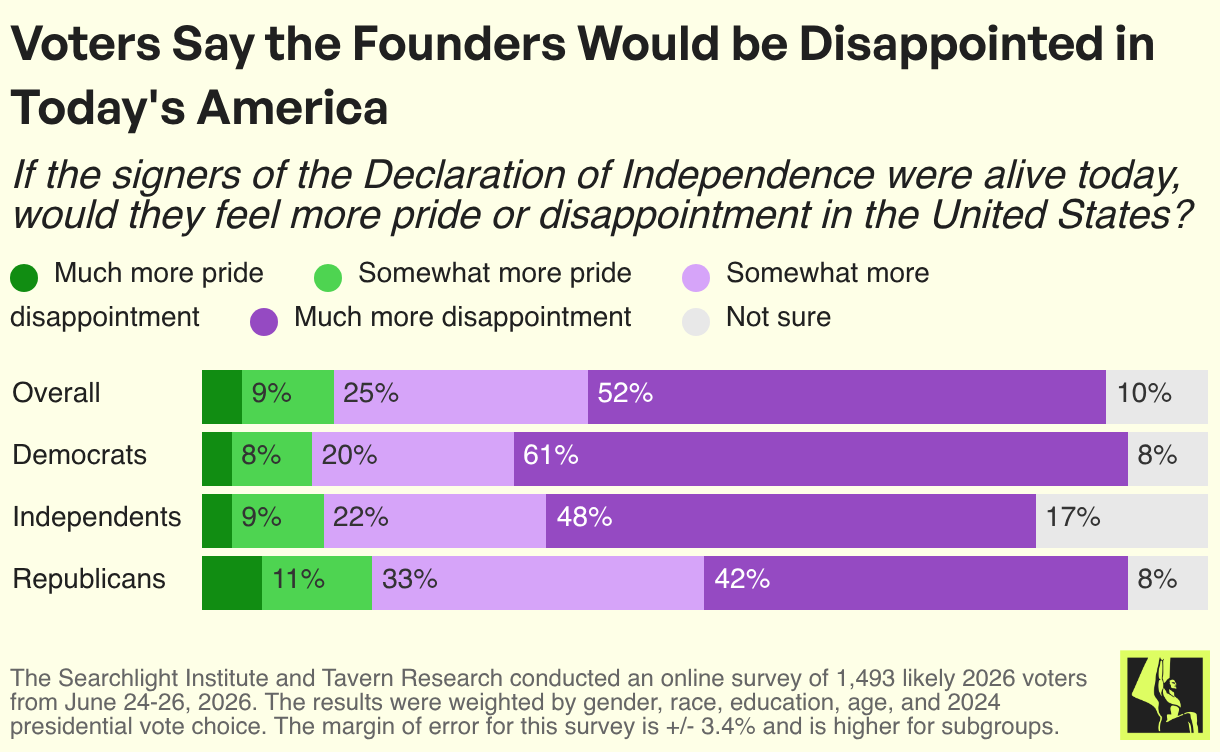
Despite these mixed-to-positive ratings on individual ideals, voters don’t feel the country is living up to the founders’ broader vision. Asked whether the signers of the Declaration of Independence would feel more pride or disappointment in America today, 77% of voters, including majorities of Democrats (81%), Independents (70%), and Republicans (75%), say disappointment.
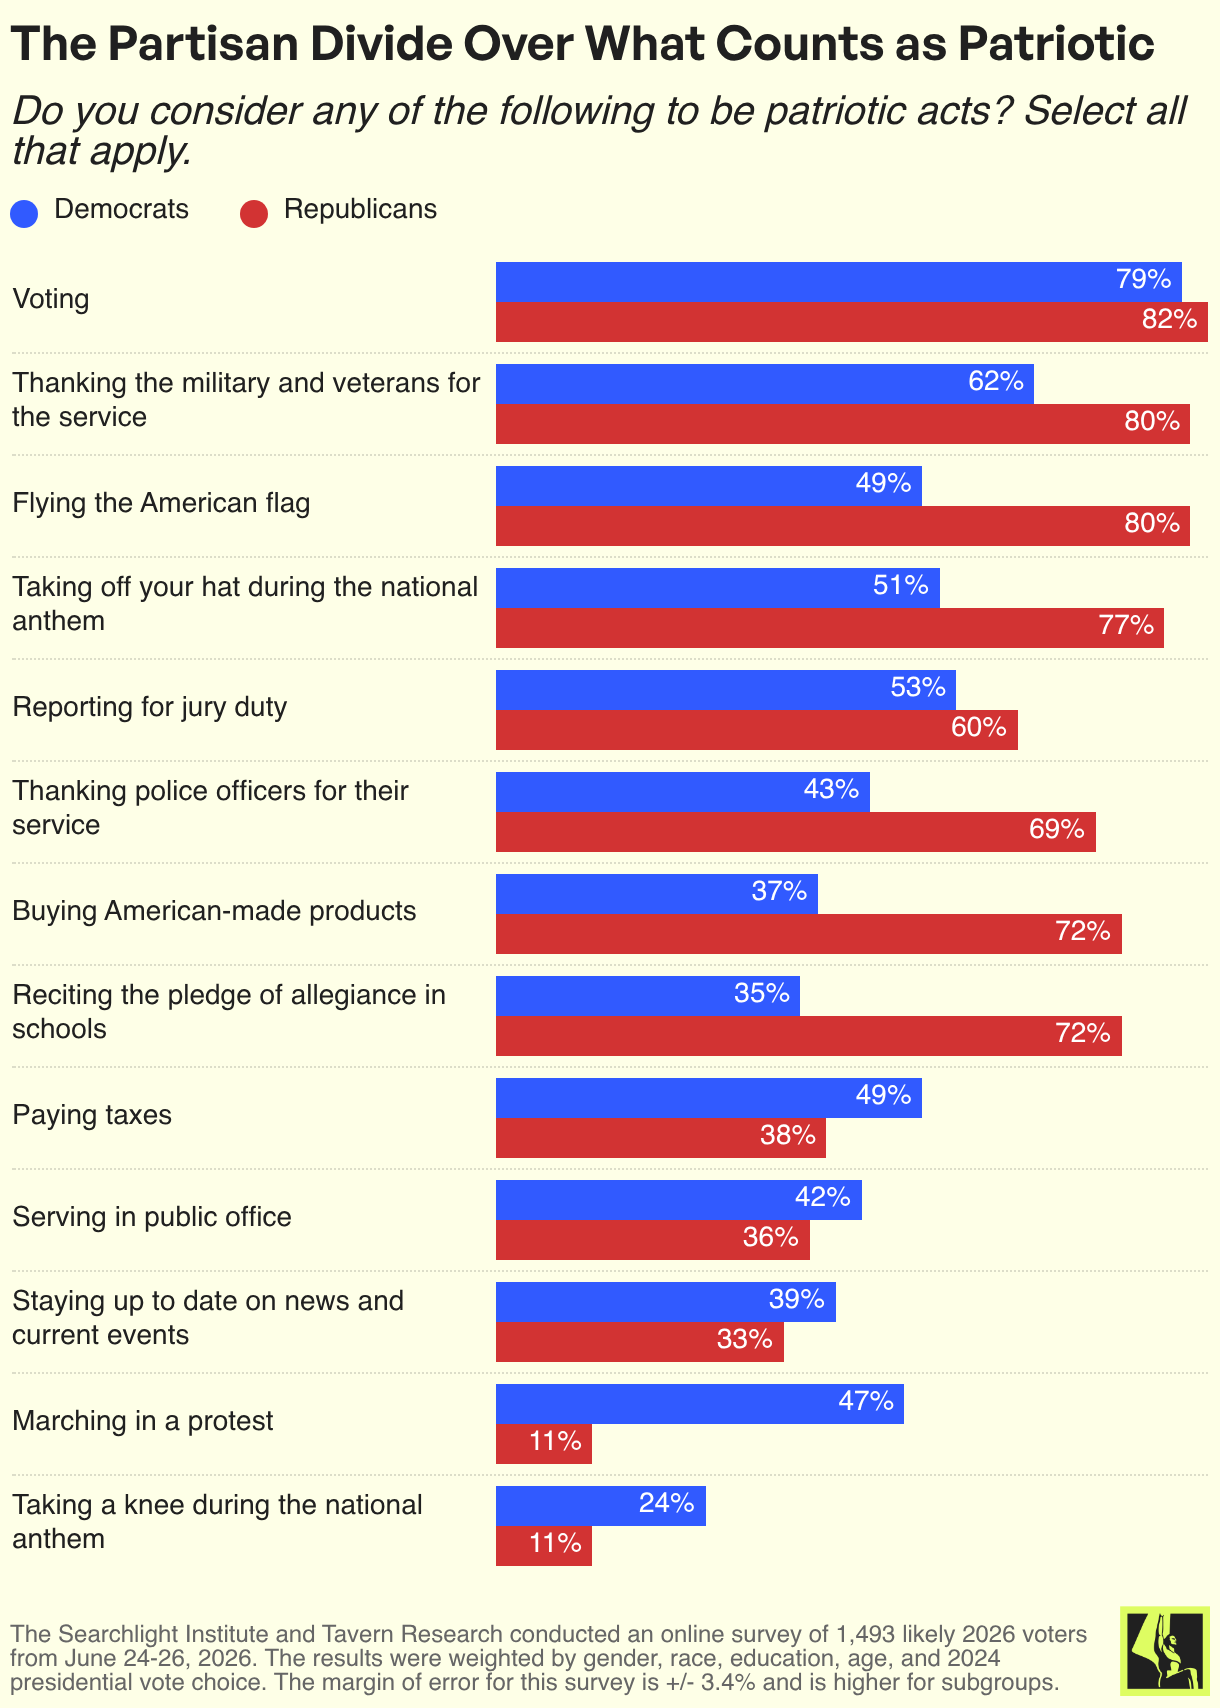
In addition to this shared sense of disappointment, Democrats and Republicans disagree sharply about what patriotism actually looks like in practice. Voting is the only act nearly all voters of both parties consider patriotic (79% of Democrats, 82% of Republicans). On the flip side, we see large divergence in whether flying the American flag (49% Democrats / 80% Republicans), buying American-made products (37% Democrats / 72% Republicans), and reciting the pledge of allegiance in schools (35% Democrats / 72% Republicans) count as patriotic acts.
As the country marks its 250th birthday, these results are both hopeful and discouraging. While Americans still hold fast to the ideals laid out in the Declaration of Independence, a cross-partisan majority think there is still work to be done to reach these lofty goals. Even where voters agree what patriotism means in principle, they disagree on how to express it.
Methodology
The Searchlight Institute and Tavern Research conducted an online survey of 1,497 likely 2026 voters from June 24 – 27, 2026. The results were weighted by gender, race, education, age, and 2024 presidential vote choice. The margin of error for this survey is +/- 3.4% and is higher for subgroups.