
Strengthening Transitions to Jobs of the Future
Key Takeaways
- Since 2000, federal inflation-adjusted funding for the Workforce Innovation Opportunity Act (WIOA) Title I and Employment Service programs has been cut in half. This decline forces state agencies to triage services.
- Current Title I distribution formulas rely on unstable metrics that produce a lot of volatility in the funding allotments states receive on a year-to-year basis. These funding swings make it difficult for workforce agencies to invest in service expansions and modernize their administrative systems.
- The current “means-tested” approach to training is insufficient if a wide range of blue-collar and white-collar workers could face displacement in an AI-driven economy. A revitalized workforce system would provide support to workers of all backgrounds to help them transition into new and growing industries.
- At minimum, Congress should restore workforce development funding to levels seen at the start of the 21st century, index for inflation moving forward, and replace volatile distribution metrics with predictable ones based on the size of each state’s labor force. A more ambitious reform effort would establish new funding benchmarks.
- These financing reforms should be paired with simplified rules, program consolidation to eliminate waste, and flexibility for agencies to test and assess new training interventions.
Introduction
Not everyone needs a fitness trainer, but they are certainly helpful. You may not know where your strength deficiencies lie nor which combination of exercises will help you build the most muscle. This is where the trainer steps in. Even if you don’t use their services each gym session, trainers can give you direction so your independent workouts are worthwhile and you accomplish your goals — whether it’s to run a half-marathon or dance at your daughter’s wedding.
A well-functioning workforce development system looks a lot like a good fitness trainer. Agency staff can provide career service advice based on each worker’s background and aggregated labor market information, and associated retraining programs can enable smooth and strengthened job transitions. Workers looking for new jobs, potentially in different industries, can benefit from this support. A major problem is that comprehensive training services through the United States public workforce development system, formally known as WIOA (for the Workforce Innovation Opportunity Act), are not available to all workers who could benefit from assistance.
Over the last few decades, this job transition “muscle” has weakened. The amount of federal funding appropriated for workforce development has eroded substantially due to inflation. Furthermore, the allotment formulas used to distribute funding to states cause substantial volatility in nominal funding on a year-to-year basis. These dynamics force state agencies and local workforce boards to triage support and hamper efforts to modernize system infrastructure.
This is an unacceptable state of affairs — especially as the adoption of artificial intelligence promises to change work as we know it. To properly support a wide range of workers going through job transitions, reforms must (1) promptly restore WIOA funding levels to where they were decades ago, (2) make job training access much more universal, and (3) adopt fund distribution formulas that provide states better predictability.
When life gives you lemons, make lemon-aid
Across a wide range of demographics, AI-driven job disruptions are a growing concern for Americans. It doesn’t matter whether someone is blue- or white-collar, fears of unemployment are prominent. This is a challenging problem given the uncertainty about all the types of work that could be affected, as well as the timeline and the extent of these impacts. However, there is a path forward.
The AI dilemma presents an opportunity for Congress to enact prudent reforms to WIOA, the public workforce development system named after the Workforce Innovation and Opportunity Act of 2014. While we may not know exactly how adoption of AI transforms work and the labor force over time, a robust set of pathways should be established to support transitions to jobs of the future — for all workers. Given that AI could disrupt a wide range of jobs, access to proven training services must be made more accessible and predictable.1
These training services could take many different forms, and policymakers should provide workforce agencies with the necessary flexibility to experiment. Notably, there is inadequate evidence about what works for different industries, and the mix of interventions that have been tried has delivered mixed results at best.2 Certain programs like Job Corps have demonstrated inadequate returns relative to the cost per participant.3
More recent studies have provided kernels of hope, though.4 Benjamin Hyman, formerly of the Federal Reserve Bank of New York, found that job training provided through the Trade Adjustment Assistance program generated positive wage and employment effects for workers.5 In a new working paper, Hyman and his co-authors also determined that job training through the WIOA system secured wage gains for AI-exposed workers, primarily by facilitating shifts into less AI-exposed occupations.6 And while other researchers have found more bearish results for WIOA — including too few program participants receiving retraining — they were encouraged by employer-led job apprenticeships.7 All of this is to say: More testing and assessing is needed to build up a well-oiled workforce system.
Such an effort involves Congress reforming how WIOA is financed. As the National Association of State Workforce Agencies (NASWA) has detailed, state and local workforce officials have listed insufficient funding as “a problem that stalks all states and underlies all of the listed challenges,” from poor user experience to the haphazard integration of data and technology systems.8 Harry Holzer, chief economist at the Department of Labor under President Bill Clinton, made a similar case during testimony before the U.S. House Committee on Education and Labor in 2023. Alongside the need for better data to inform program efforts, Holzer argued for renewed investment in WIOA to counter the decline in federal spending on workforce development over the last 50 years.9
Congress gets what it pays for, and for too long, the result has been a constrained and underperforming workforce development system. Without more robust and reliable funding levels, it will be difficult to serve a wide range of workers and adequately experiment with promising interventions.
Background
Since the turn of the century, Americans have navigated two iterations of the public workforce development system. The first version was seen under the Workforce Investment Act of 1998 (WIA). The Workforce Innovation and Opportunity Act of 2014 (WIOA) replaced it and remains the law of the land today. Although many aspects of WIA were retained in WIOA, greater emphasis was placed on integrating and streamlining a collection of workforce programs under the same roof — “one-stop” centers — with the use of technology.10
Each year, Congress appropriates funding for major programs found at the one-stop centers. The exact funding levels are left to the discretion of lawmakers, while there are statutory formulas used to distribute the funds across states.11 State governors must then follow requirements on how they distribute and use the funds received.12 There is the ability to set a minority of the funds aside for statewide activities, while most funds are passed along to the 570-plus workforce boards located across the country.13
A range of frustrations exist with the current workforce system and the federal approach to re-employment assistance. Some workforce boards only serve a small number of workers.14 Programs have strict regulations that can make it difficult to provide assistance.15 Federal programs can also lack sufficient evaluations to determine effectiveness.16 More broadly, there is disorganization at the federal level. Workers can be confused about the eligibility criteria for various programs and whether they qualify for support.17 Although 19 programs must participate in the one-stop model set up via WIOA, many employment programs are scattered elsewhere across the federal government.18 Simpler rules, greater flexibility in how to use program funds, and more centralized program administration could all help improve performance.19
These problems point to the need for workforce program financing reforms. States and workers would benefit from a return to workforce development funding levels seen decades ago and the adoption of more predictable distribution formulas. An even more ambitious effort would look to bring U.S. investment on these sorts of “active labor market” programs in line with what other wealthy nations spend.20
Since the turn of the century, funding for central programs stationed at one-stop shops has been significantly eroded by inflation.21 These long-term dynamics have made it harder for local workforce boards and state agencies to assist workers over time. With fewer real resources available, training services are, in effect, means-tested rather than universal.22 Since a share of WIOA grant funding is applied toward administrative functions, this decline has impaired the ability to modernize administrative technology and systems as well.23
The statutory formulas used to distribute WIOA grant funds hurt states, too. High variability in year-to-year funding levels actively impedes agencies’ ability to make forward-looking decisions and investments.24 Even if a state sees its program funding level increase one year, it could be wiped away the next. This can make it difficult for officials to permanently expand types of services, assess how to best assist workers over time, and commit the additional funding to new budget line items that incur ongoing expenses. Unemployment insurance agencies face a very similar set of problems due to the way that their administrative funding grants are structured.25
The rest of this report focuses on four core programs: the Youth, Adult, and Dislocated Worker programs established through Title I of the law, and the Employment Service, addressed in Title III. This is for a few reasons. The first is that a majority of the funding appropriated via WIOA is through Title I of the law.26 Secondly, the Employment Service is instrumental to help supply basic career service guidance to all workers — a key element of the one-stop model. Lastly, each of these program partners is overseen by the Department of Labor.27 If more workforce development funding is to be provided, it should be done through a consolidated set of programs overseen by the main federal labor agency.
The programs and how funding is distributed to states
Title I programs: WIOA Youth, Adult, and Dislocated Worker
Title I of the WIOA establishes core programs that support adults, dislocated workers impacted by disruptions like mass layoffs, and at-risk youth.28 These programs provide job seekers with access to career, education, and training services while helping connect employers with available workers for in-demand jobs. Each is funded with formula-based federal grants and administered by state and local workforce development boards. Title I program funding levels have seen dramatic declines due to inflation since 2000.
The Adult and Dislocated Worker programs serve individuals 18 and older, although their eligibility criteria differ. The Adult program provides priority to low-income individuals and those on public assistance with large barriers to employment.29 The Dislocated Worker program is designed for individuals who have been laid off and are unlikely to return to their previous occupation or industry.30 Each program offers career services like job search assistance, labor market information insights, and training services, including on occupational skills training and on-the-job training.
The WIOA Youth program focuses on helping young Americans (ages 14 to 24) who face significant barriers to education and employment. There is a general requirement for states and local boards to spend at least 75% of funds on out-of-school youth (OSY), although states can receive waivers to enable more flexible spending.31 The program includes 14 elements, including tutoring, alternative school services, occupational skills training, and guidance counseling, among others.32 WIOA Youth is meant to improve participants’ educational and job outcomes.
Each Title I program has a distinct distribution formula composed of a trio of metrics (see Appendix A).33 Each metric determines one-third of a state’s program allotment. WIOA Youth and WIOA Adult determine a state’s level of program funding according to its relative share of total unemployed population in “areas of substantial unemployment” (areas with an unemployment rate equal to or above 6.5%), “excess unemployed” workers (unemployment in excess of a 4.5% rate), and “disadvantaged” youth or adult population (below the poverty line or a separate low-income threshold).34 WIOA Dislocated Worker applies the same excess unemployed (EU) metric alongside states’ relative shares of long-term unemployed workers (unemployment spells with a duration of 15+ weeks) and total unemployed.35
The metrics fluctuate a lot between years, making the formulas complicated and unpredictable. Stop-loss and stop-gain measures are in place to limit fluctuations between years.36 States are guaranteed to receive at least 90% of their relative share of program funding from the previous year and no more than 130%. But ensuring a minimum share does not ensure a minimum level. If Congress cuts the budget for the entire program, the whole pie gets smaller. In that case, even if a state is guaranteed to receive 90% of its relative share from the prior year, its actual dollar amount could still drop below 90% of what it got the previous year. On the flip side, if Congress supplies the program with more money, a state capped at the 130% funding share limit could receive a funding level greater than 130% of the prior year amount.
Employment Service (ES)
The primary purpose of Employment Service (ES) is to help workers and employers connect with one another. Staff-assisted job search support and recruitment for employers is available, as are self-serve options. Workers often get their initial one-stop assistance via ES. While ES was established through the Wagner-Peyser Act, WIOA made the program a critical component of one-stop centers.37
ES is funded through fiscal year appropriations like the Title I programs, although the key funding source — the Federal Unemployment Tax — is different.38 Ninety percent of the appropriated funds must be applied toward job placement and career services.39 Meanwhile, state governors can use the other 10% to pay for program performance incentives and additional costs of covering proven services.40
The main ES state distribution formula — used to disburse 97% of ES funds — is more stable than the Title I formulas.41 Two-thirds of funds are disbursed according to each state’s relative share of the civilian labor force, and the other third is disbursed according to each state’s relative share of total unemployment. There is a 90% stop-loss mechanism in place, like the Title I programs.
Unlike the Title I programs, though, no state has seen a drop in ES funding this century that has brought its level down to 90% of the prior year total. Furthermore, no state has seen its ES funding level increase to 130% of the prior year total despite the lack of a stop-gain measure to limit change in relative funding share.
The use of civilian labor force as the primary formula metric helps to minimize the volatility of state funding over time. Nevertheless, states have seen their ES funding take a real hit due to inflation — the same issue seen with the Title I programs.
The food is terrible and the portions are too small
Federal appropriations have been eroded by inflation
Each year, Congress makes discretionary appropriations that determine exactly how much states collectively receive for WIOA Title I programs and the Employment Service. States must submit plans that map out the program strategy over four years, abide by federal requirements, and follow reporting standards to receive program grants.42 General revenue is spent on Title I appropriations, while Federal Unemployment Tax dollars primarily cover the cost of the Employment Service.43 Although the revenue source varies, there is a consistent and chronic funding problem across these programs: Eroding appropriations levels limit their reach and scope.
Over the course of the past 25 years, the amount that Congress appropriates annually for WIOA Title I programs and the U.S. Employment Service — central job support services delivered through local workforce boards and American Job Centers — has been cut in half when accounting for inflation.44 This can be seen in Figure 1.45 The annual funding level across these four programs hovered around $4 billion in the early 2000s, and now sits at around $2 billion when accounting for inflation.46 This follows a significant, inflation-adjusted decline in funding for key services between the 1980s and 2000s.47
Figure 1:
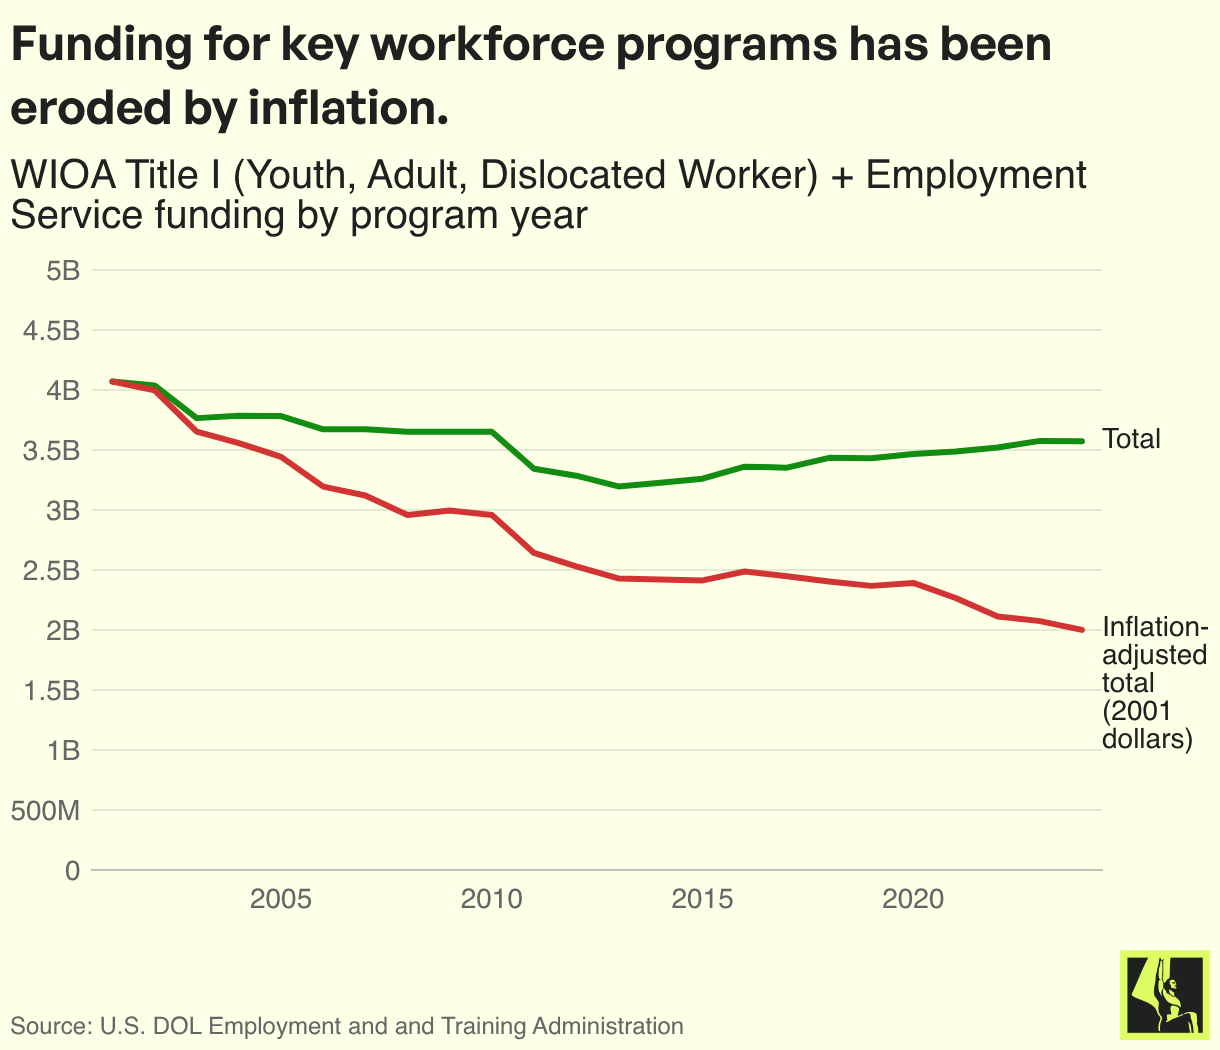
Figure 2 (a-d): The weakened congressional appropriations have hurt virtually all states
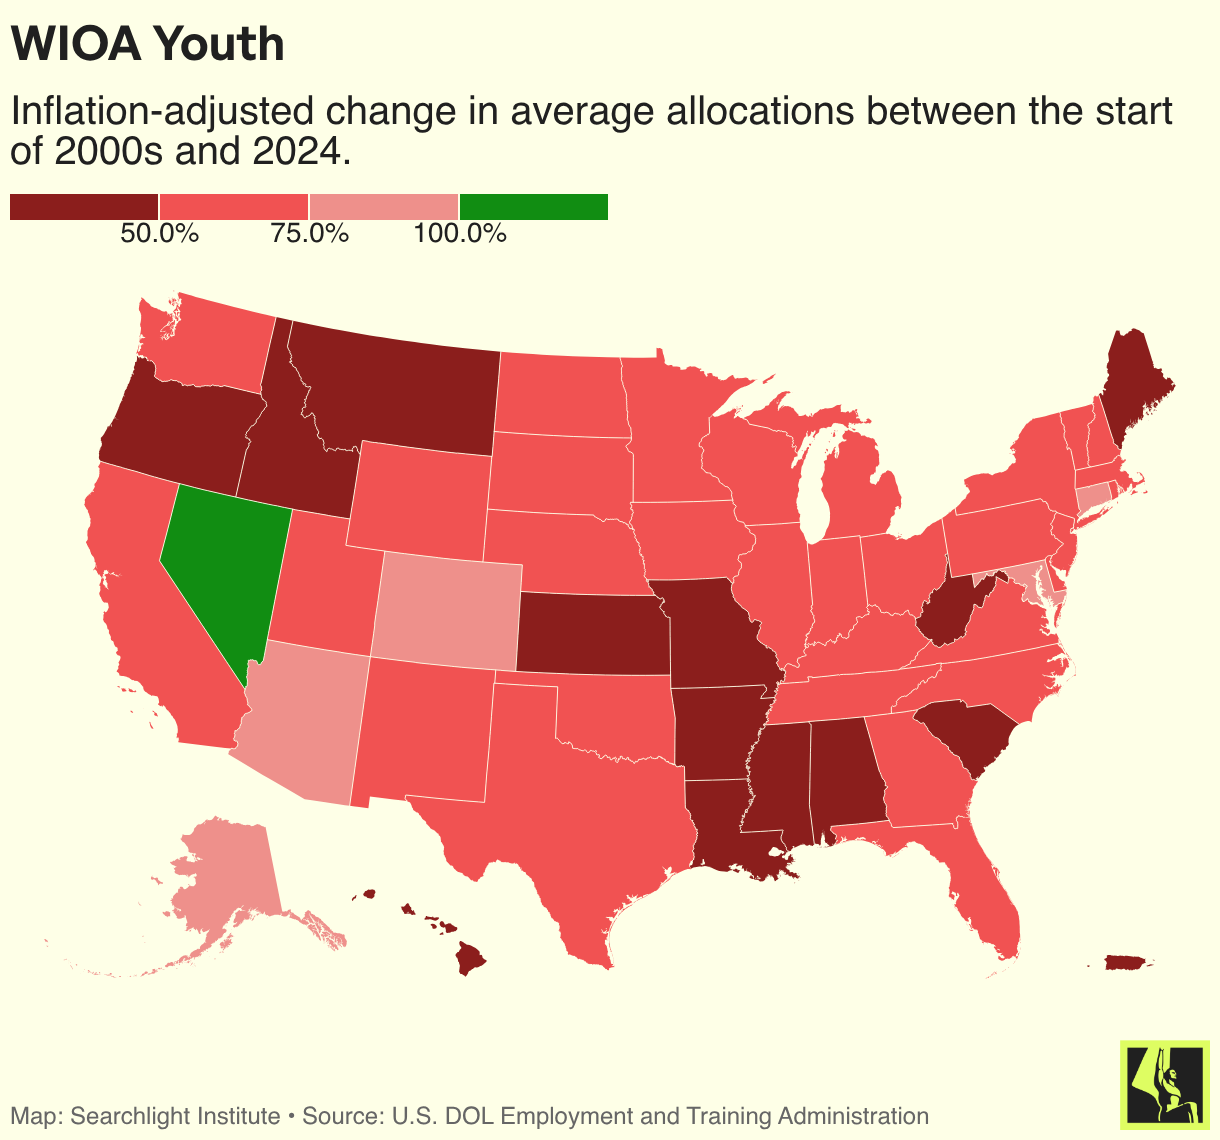
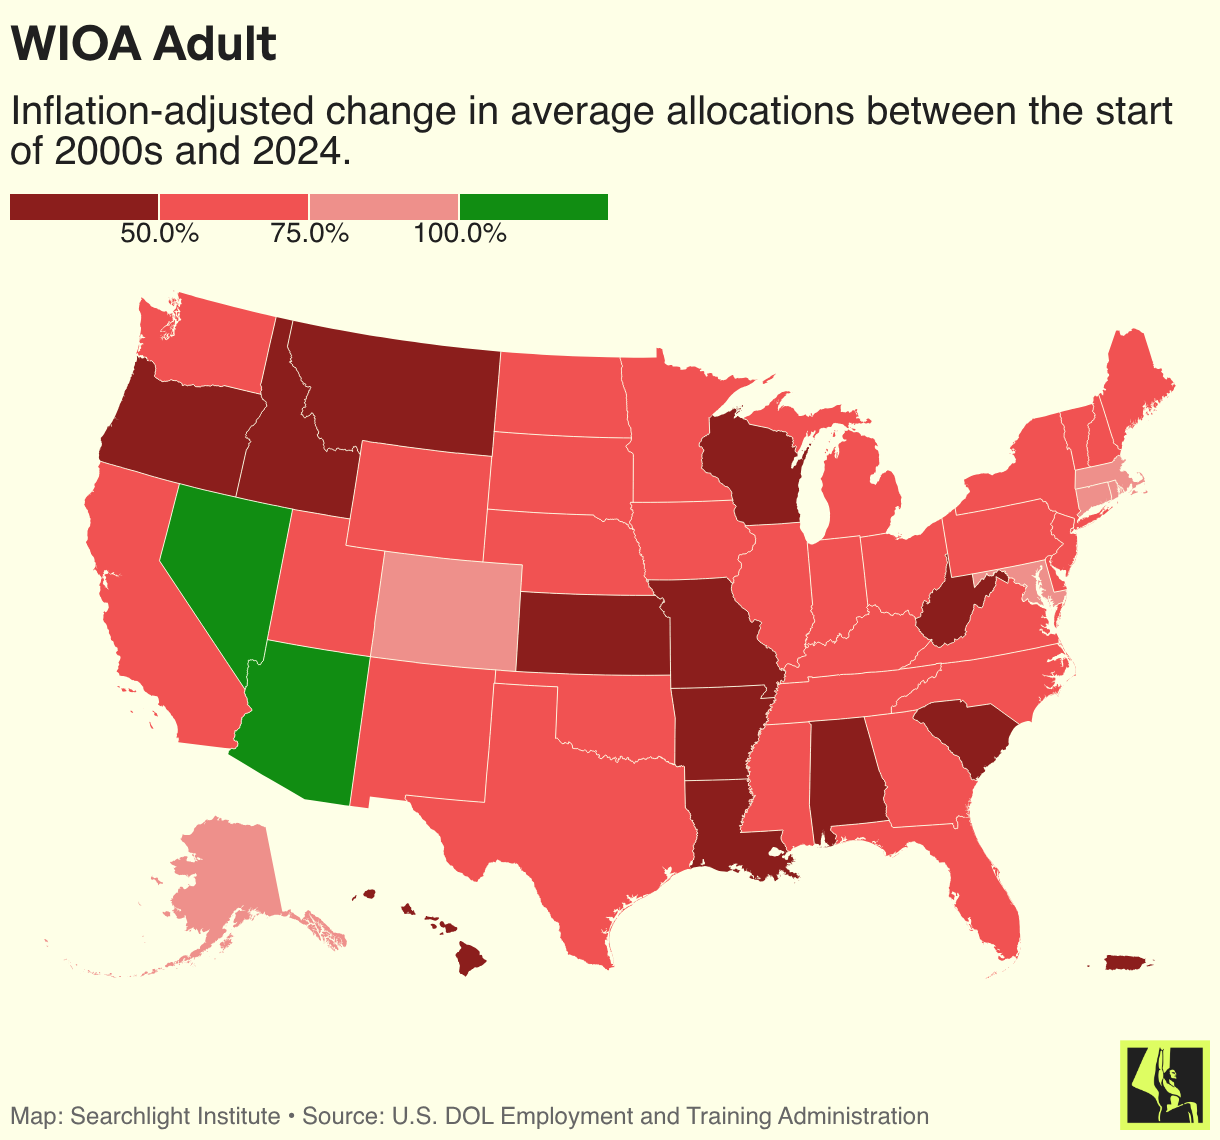
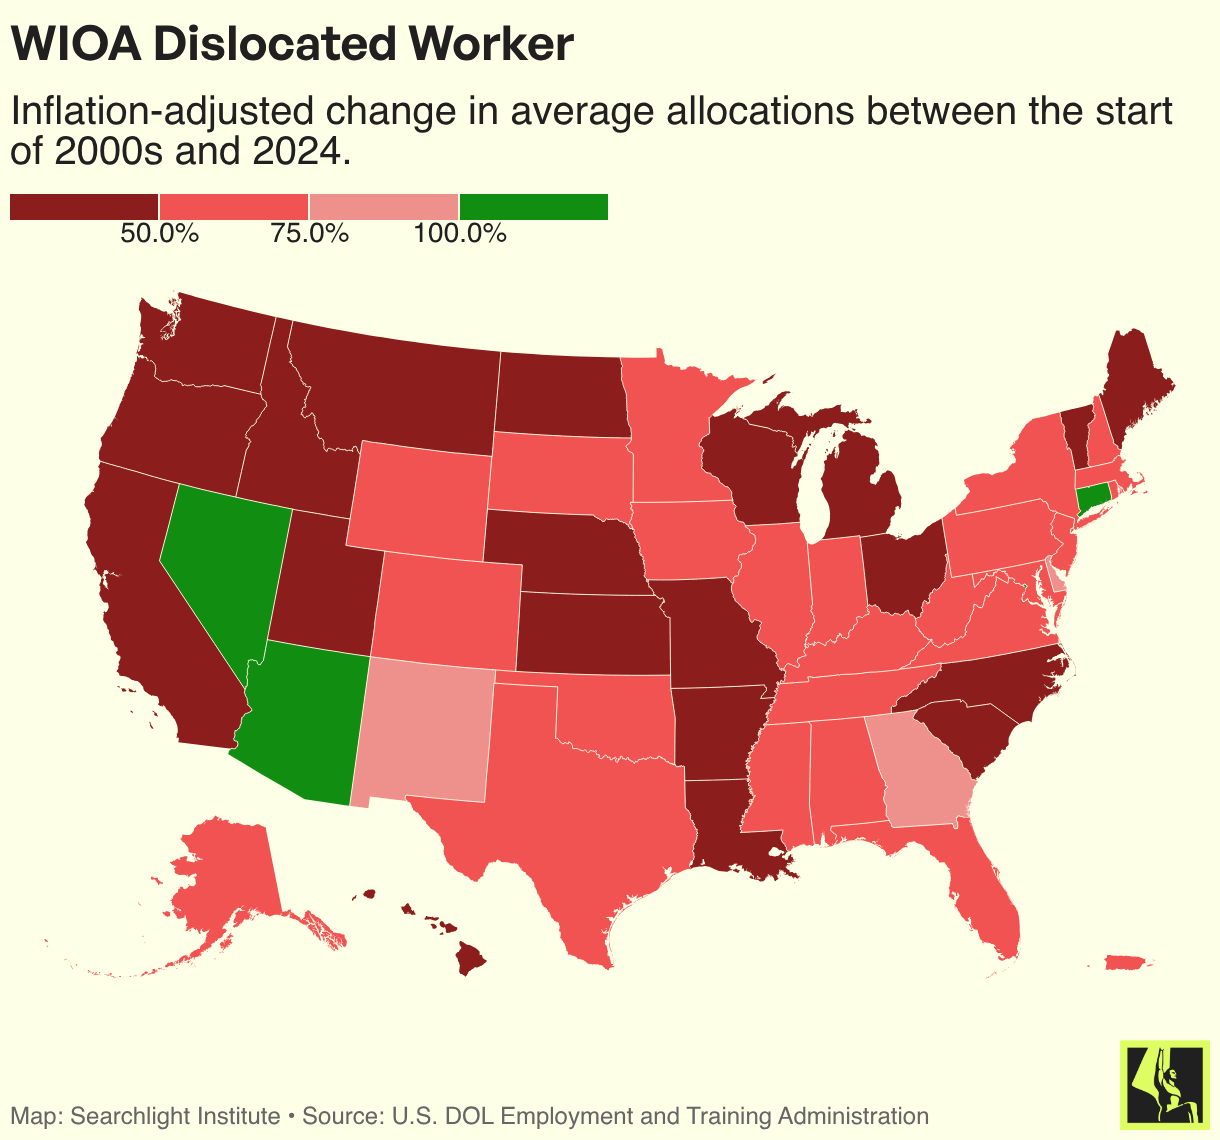
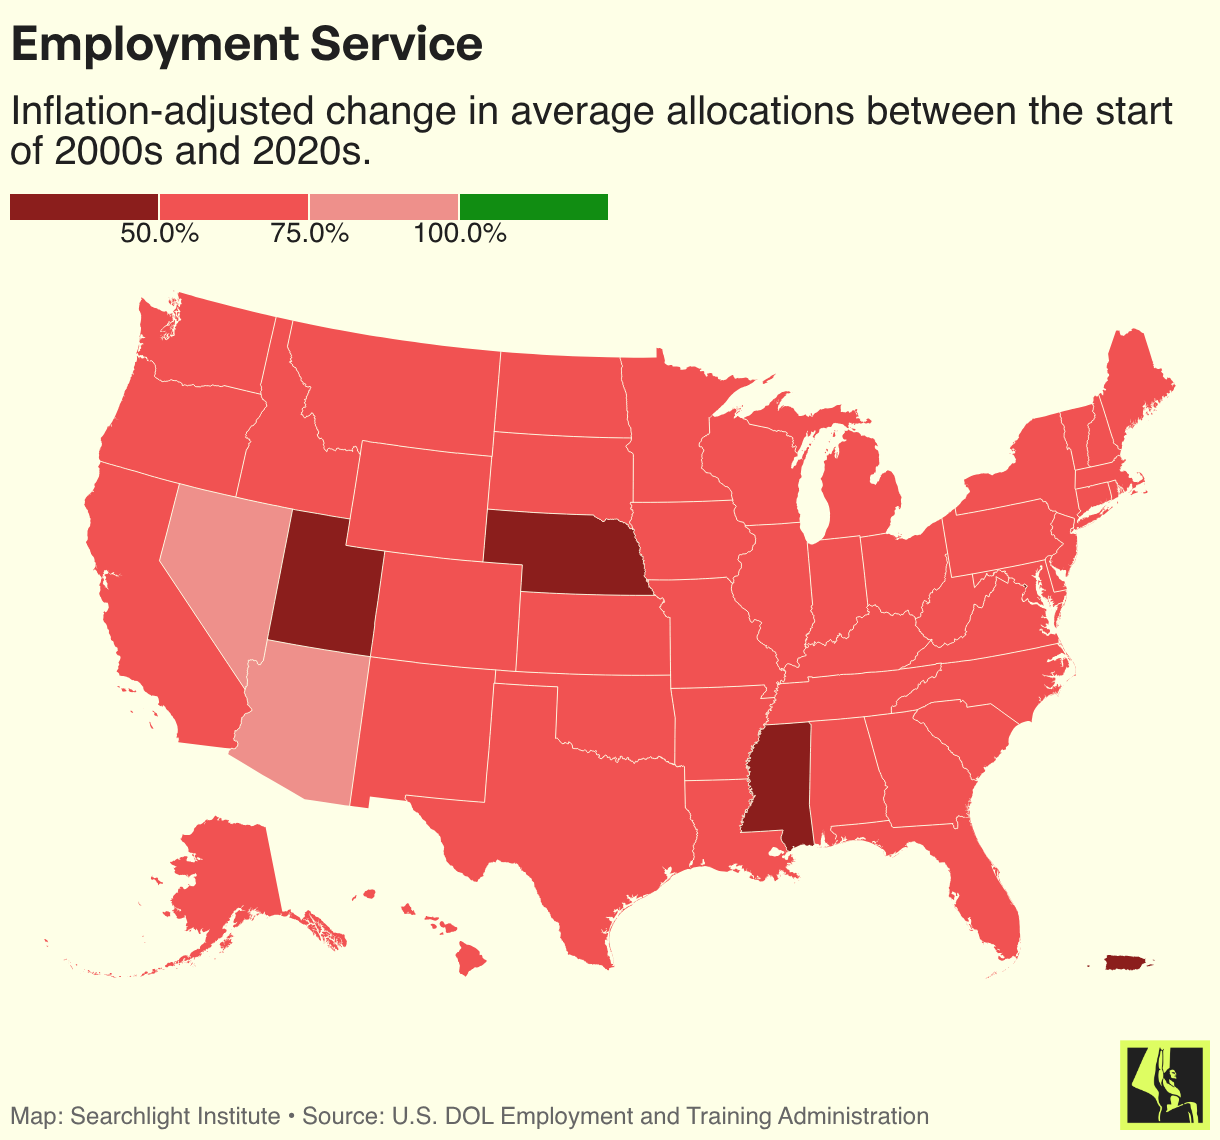
The number of states with larger inflation-adjusted resource levels for any program fit on one hand. For WIOA Youth, only Nevada has seen a real increase in its funding level between the first five years of the 2000s and the first five years of the 2020s. A similar story is seen with WIOA Adult and Dislocated Worker, where Arizona and Nevada are in better funding positions relative to the early 2000s. Meanwhile, Washington, D.C., and Connecticut have seen an increase for just the WIOA Dislocated Worker program. Every state is in a worse position when it comes to Employment Service funding allotments.
The decline in funding has direct implications for how many workers can receive more intensive job support services and training. Worse funding (in real terms) means that fewer workers can be effectively served.48 Although access to basic career services remains broad, workers on public assistance and those unlikely to obtain meaningful employment must be prioritized. Meanwhile, more individualized support and training through WIOA can be quite limited.49
Worse funding levels can impact the quality of service delivery as well. Workers may have access to fewer comprehensive offices, a prominent development during the 2000s.50 It can also be difficult for states to spend on more innovative projects and experiment with new interventions.51 In other cases, the lack of stable investment makes it challenging to establish strong relationships with proven community organizations and develop effective practices.52
Lastly, the weak appropriations impede efforts to move away from antiquated service delivery systems and technology. Title I grants help to cover the cost of program administration, but include key statutory limitations.53 State agencies and workforce boards can only apply a small percentage of the appropriations toward administration:
(1) As part of the 15 percent that a State may reserve for statewide activities, the State may spend up to 5 percent of the amount allotted under secs. 127(b)(1), 132(b)(1), and 132(b)(2) of WIOA for the administrative costs of statewide activities.
(2) Local area expenditures for administrative purposes under WIOA formula grants are limited to no more than 10 percent of the amount allocated to the local area under secs. 128(b) and 133(b) of WIOA.
As the appropriations have declined in value, so have the funding levels for program administration.54 A similar — albeit less consequential — dynamic has played out with the Employment Service funding, where the secretary of labor can only reserve a small percentage of the funds to help ensure states cover the cost of administrative functions.55
Congress is not the only potential source of administrative funding, but is arguably the most important one.56 The spending limitations lock in inflation-driven losses for program administration, forcing state agencies and local workforce boards to administer services with a hand tied behind their back.
States receive unreliable allotments each year
To make matters worse, the funding shares that states receive on a yearly basis can be quite volatile.57 The statutory formulas used to calculate each state’s share of program funding drive this problem because the distributions depend on unstable metrics.58 Instead of basing funding shares strictly according to states’ labor force size, higher variance unemployment data is often used. States fight for a share of a shrinking pie, and can receive significantly different amounts depending on the year. Long-term investments and planning — whether to add new services or modernize system technology — are much more difficult to execute on as a result.
The Title I programs have been particularly vulnerable to these dynamics. This funding unpredictability is presented in Figure 3(a-c), which shows how states’ Title I program allotments compare to the preceding year between 2000 and 2024. Missouri is shown in red; all other states are in gray. The visuals may look confusing — and that’s because the fiscal conditions have been quite so. States cannot reliably anticipate their year-to-year funding allotments.
Figure 3 (a-c): State distribution formulas compound the funding problem by increasing volatility between years
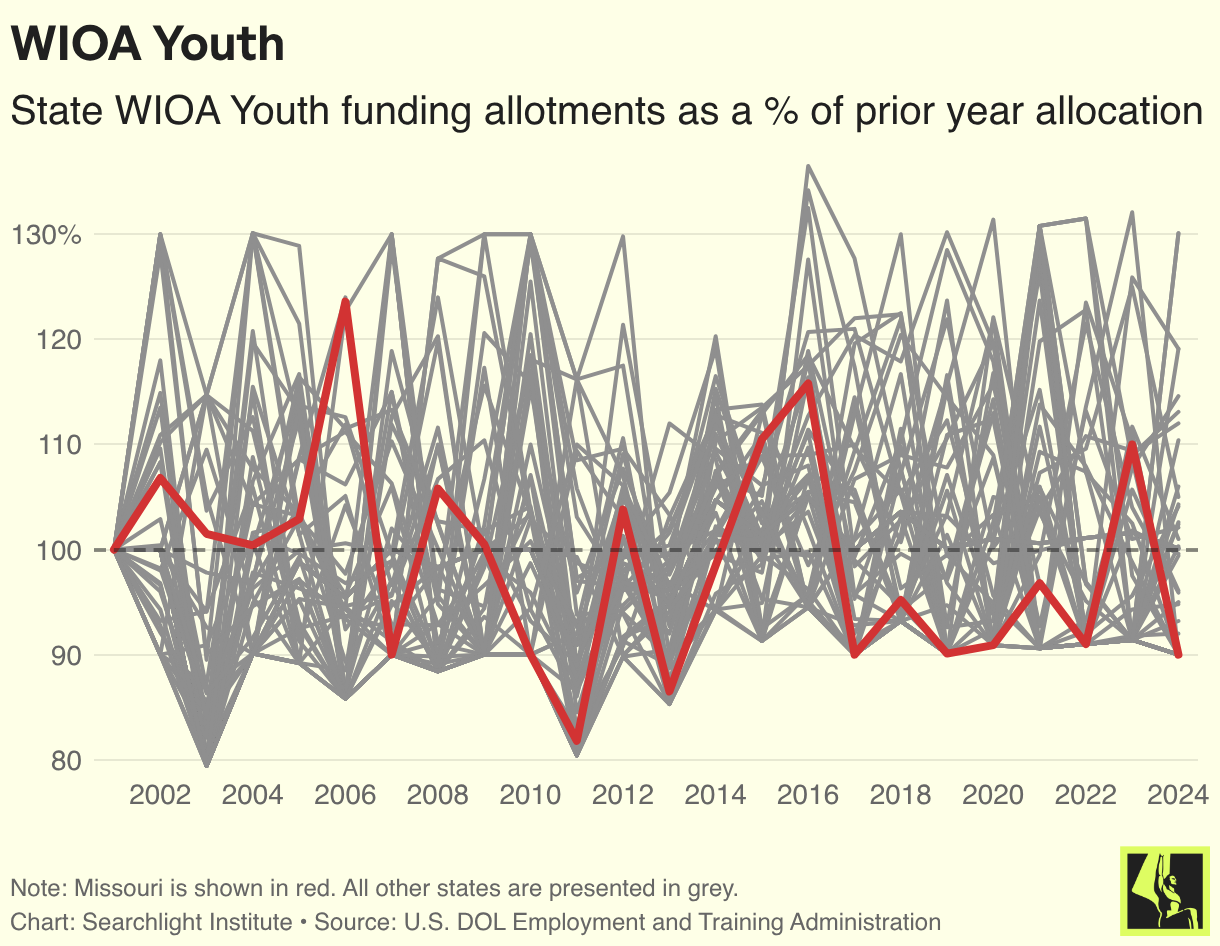
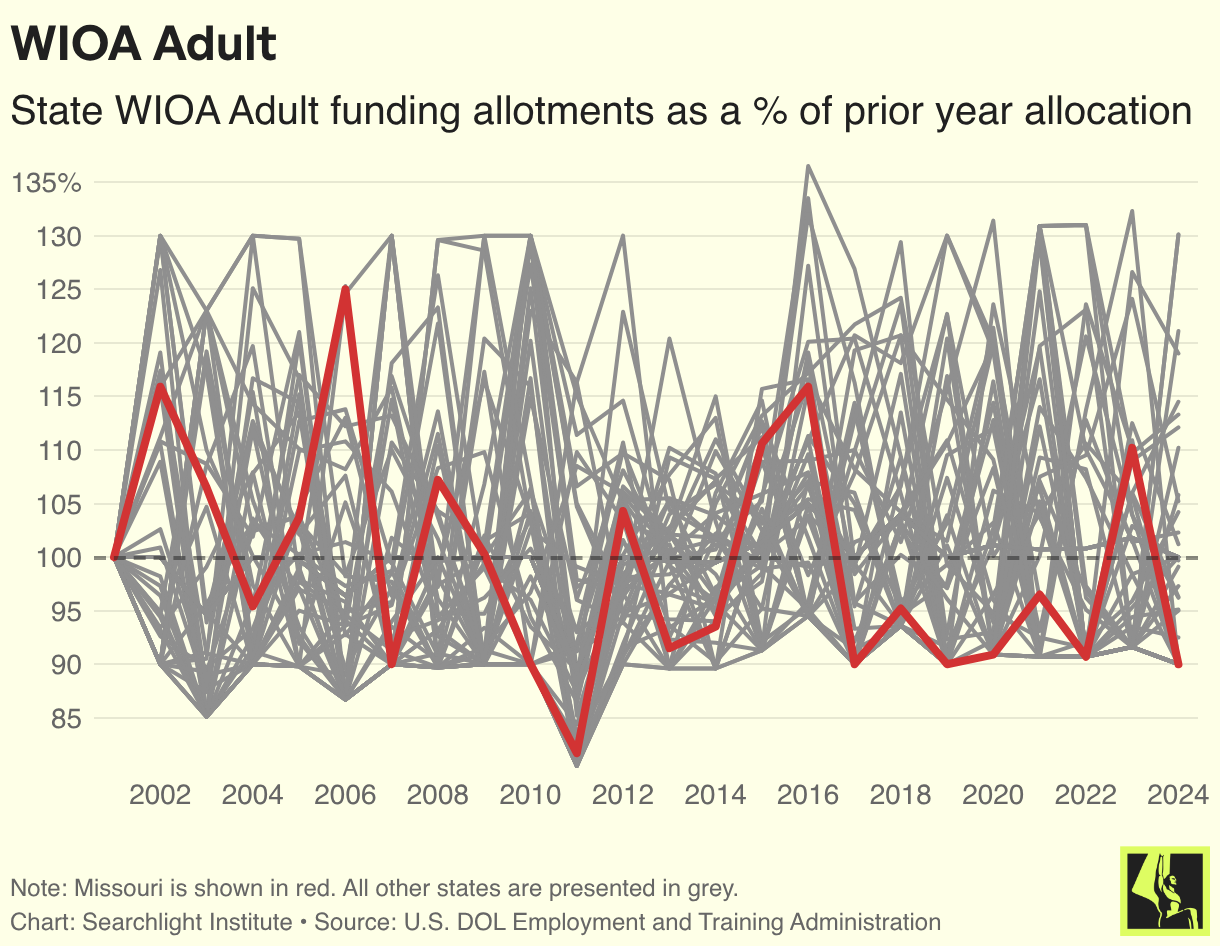
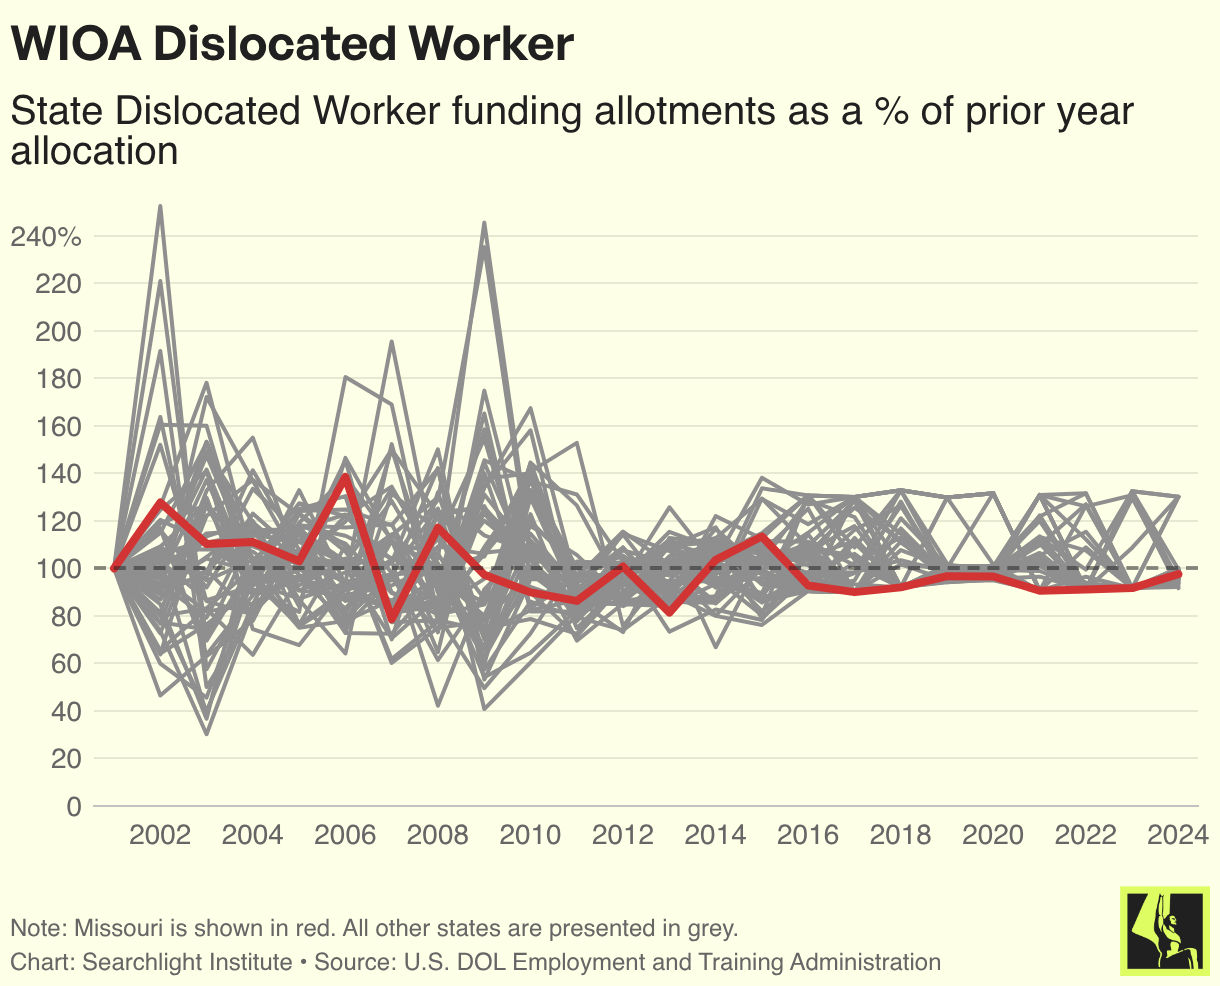
During the 2000s, states could see their WIOA Youth and Adult funding totals drop as much as 20 percentage points between years. Even with the stop-loss measures in place, federal funding declines could push state funding levels under 90% of the amount received in the prior year. States experienced the biggest fluctuations under the Dislocated Worker program, which lacked stop-loss and stop-gain measures prior to WIOA. States’ Dislocated Worker funding allotments could drop 60 percentage points between years, or more than double in size.
Although the situation was arguably worse under WIA, poor fiscal conditions remain. Under WIOA, states have roughly seen anywhere between a 10-percentage-point decline and a 30-percentage-point increase in their program allotments in consecutive years. Funding fluctuations repeatedly occur between years. A state can receive an increase one year only for it to be wiped away the next year.59 Services offered in a given year are not always available the next due to this funding variance, contributing to an environment where job seekers have difficulty understanding what services they can expect to receive.60
To use Missouri as an example: The state received fund increases for WIOA Youth, Adult, and Dislocated Worker programs in 2015 and/or 2016, but has almost exclusively seen funding declines across all three programs in the years since. States cannot take full advantage of funding increases — like Missouri received a decade ago — if there’s little reliability. The risk of subsequent funding declines impedes spending on new efforts with recurring costs.
Congress did start to address volatile Title I funding when shifting from WIA to WIOA. Notably, stop-loss and stop-gain measures were added to the Dislocated Worker program. These thresholds moderated the year-to-year funding shifts in that program.61 No state can see its relative Dislocated Worker funding share drop below 90% or rise above 130% of the funding share received the prior year.62 Nevertheless, the usage of stop-loss and stop-gain provisions amounts to papering over cracks.
Substantial funding volatility remains because the Title I programs continue to rely on unstable formula metrics. Critically, state-specific allotments are being based according to subsets of subsets of the American population. WIOA Youth and Adult provide funding to states according to how many unemployed workers are in areas of substantial unemployment (the ASU metric) and cause the unemployment rate to exceed 4.5% (the EU metric). The two programs also look at the state share of economically disadvantaged youth and adults. The Dislocated Worker program applies the same EU metric, in addition to measures that gauge the proportion of long-term unemployed workers (15+ weeks) and total unemployed in each state.
States see their relative shares of these subpopulations shift a lot between years. As Benjamin Collins of the Congressional Research Service has demonstrated, the typical state sees somewhere between a 10-to-30-percentage-point shift in its relative share of the ASU and EU actors between consecutive years (Figure 4).63 Although the total unemployment rate is more stable, 19 states have still seen a double-digit change in their relative share between years, on average. This is the key reason why each of the Title I programs produce such variable state allotments between years. Stop-loss and stop-gain measures fail to truly address the core cause.
Figure 4
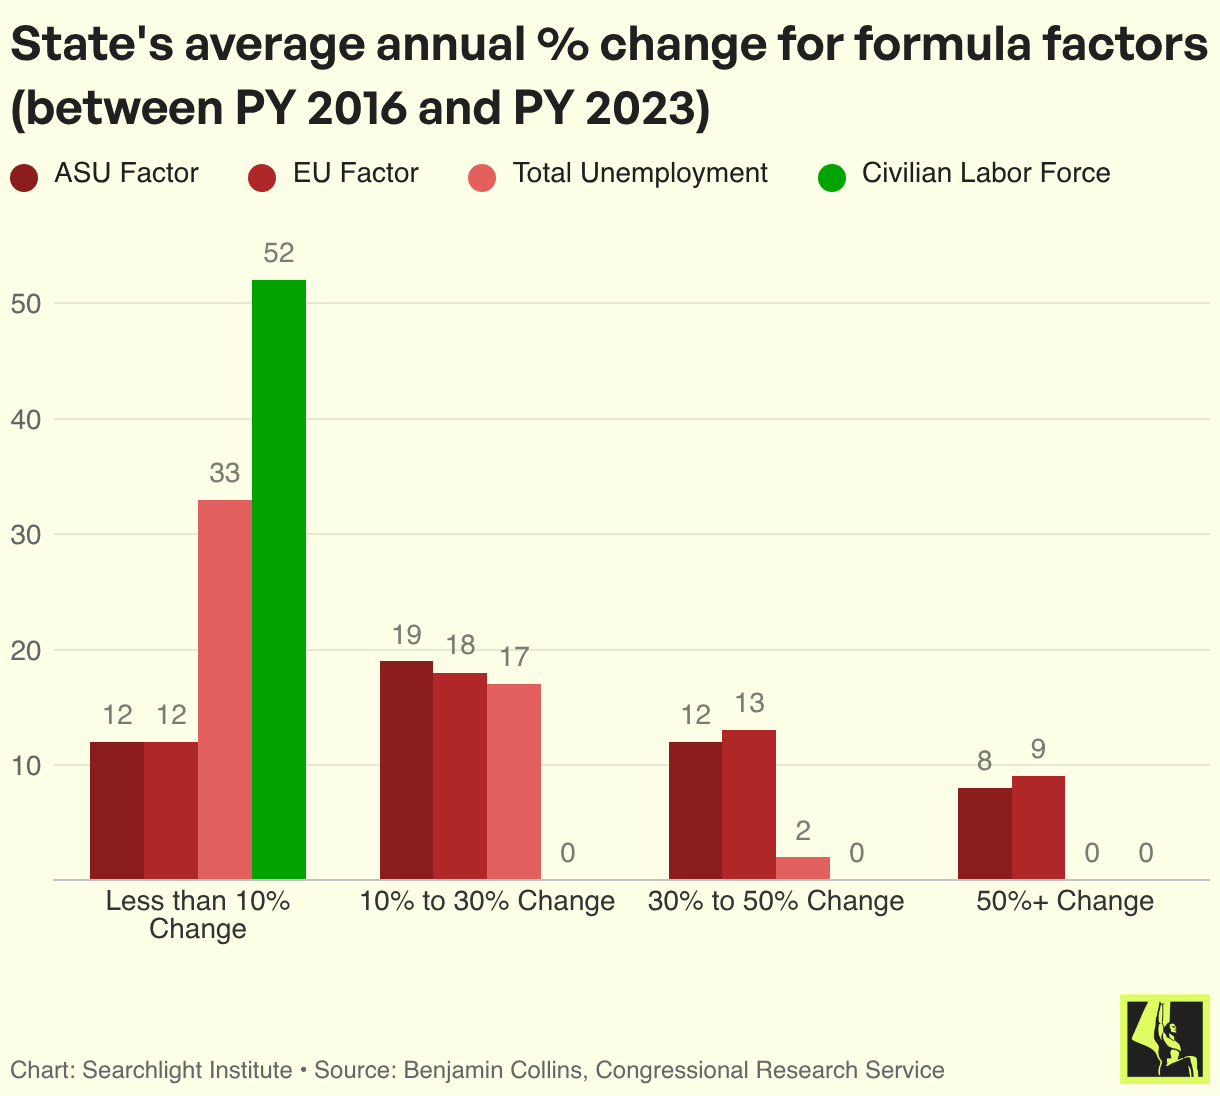
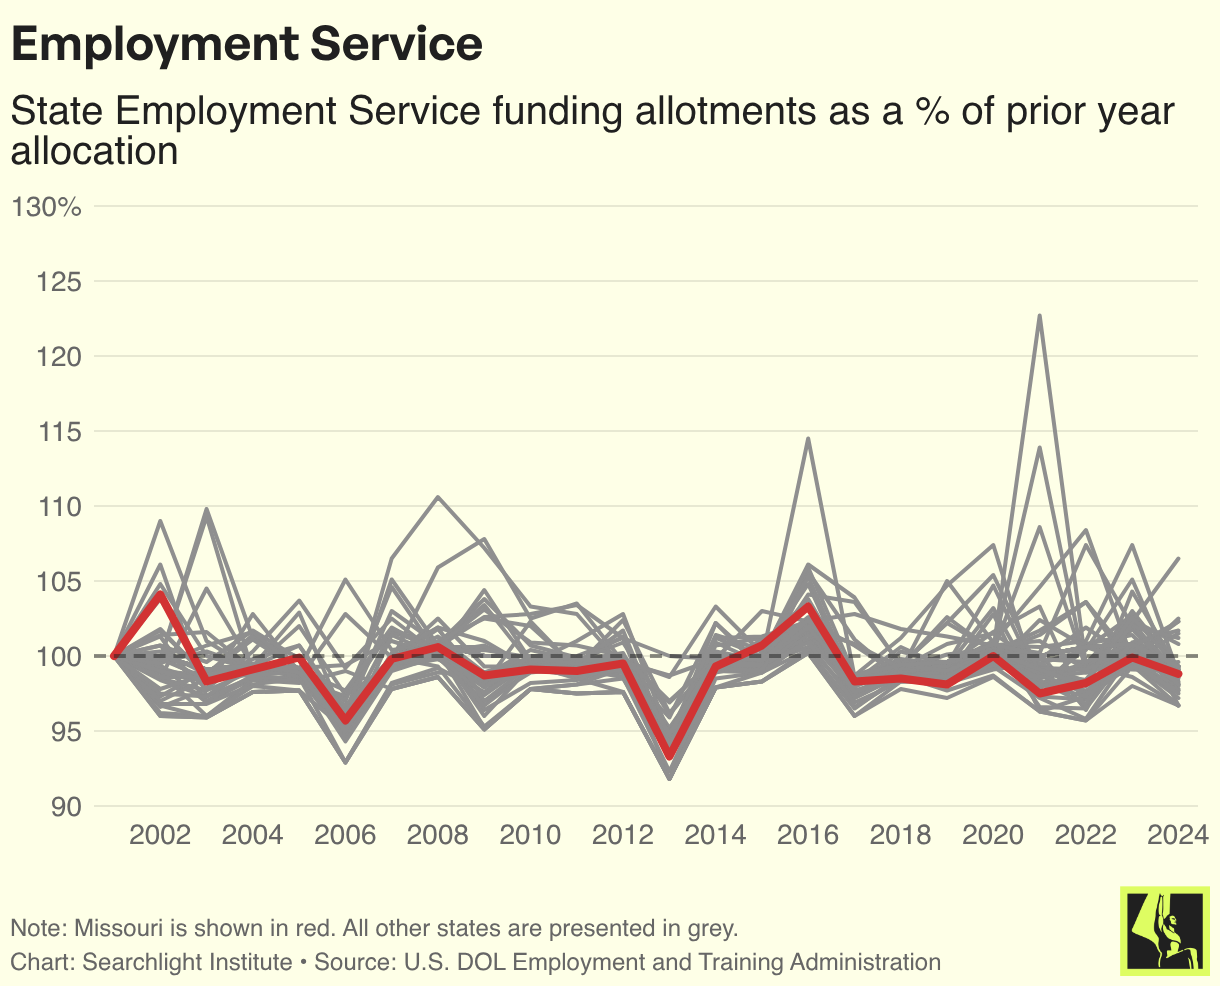
States do not suffer from the same level of fund volatility with the Employment Service program. Although the ES formula factors in states’ relative shares of total unemployment — which can have notable variance between years — the metric plays a minor role. The state ES program distributions primarily depend on each state’s relative share of the civilian labor force, a much more stable measure between years.64 Every state’s relative share of the civilian labor force has adjusted by fewer than 10 percentage points in an average year (seen in Figure 4).
States experience more modest changes in ES allotments between years as a result (seen in Figure 5). ES applies the same stop-loss measure used by the Title I programs, but there’s been little need for it. This century, no state has seen its annual allotment drop below 90% of the level from the prior year. Furthermore, no state has met or exceeded 130% of its prior year funding level even though ES lacks a stop-gain measure.
Figure 5
WIOA Title I programs would benefit from adopting similar distribution formulas and metrics. State allotments should be structured according to their working population size — just not the narrow populations currently used to determine states’ Title I funding amounts. Such hypertargeted metrics have made state funding conditions much too uncertain. Fixing the formulas may not resolve the overall erosion due to inflation; however, it should be viewed as a complementary reform. If workforce agencies and boards are going to make the most of the dollars received, the funding levels must become durable and reliable.
How to fix workforce development funding
Funding for WIOA Title I and Employment Service (ES) programs has fallen behind the times. These inflation-adjusted declines have been amplified by unpredictable state-level allotments, which make it challenging for state and local agencies to pursue ambitious plans and serve a broad swath of workers. To better support the workforce system, policymakers should aim to bolster the size of these funds and reliability of the distribution process. Congress should ensure that annual program funding levels properly account for inflation or wage growth. Furthermore, states should receive funding based on the size of their entire workforce rather than subpopulations that fluctuate a lot between years.
Adjust program allotments for past and future inflation
Funding levels for the Title I programs and the Employment Service have been cut in half since 2000. At minimum, Congress should undo that erosion by doubling the annual funding for these programs. This would require doubling the annual appropriations level for Title I programs and the Employment Service from $4 billion to $8 billion. A more ambitious approach would go beyond restoring the value of spending on these types of workforce development programs. This greater level of commitment — which Searchlight Institute supports — could make training services much more universal, and enable greater experimentation to determine which training interventions are the most effective and warrant further investment.
To prevent future passive cuts, program funding levels should adjust for inflation or wage growth over time. By indexing for increased costs, the federal government can ensure that this “job transition muscle” keeps pace with the actual costs of training and program administration.
Adopt formulas with broader, more predictable metrics
Reforming the distribution formulas for workforce programs will help agencies and workforce boards make the most of the renewed funding. The complex formulas used for Title I programs — which rely on volatile submetrics like ASU and EU — should be replaced with more stable, simpler ones. The Employment Service funding distribution formula is a solid model to emulate. By basing program funding levels according to a state’s total civilian labor force size, the federal government can provide agencies with a more predictable budget over time. This formula fix is all the more justified if the goal is to guarantee job training services to workers of all backgrounds.
State and local workforce boards would be able to make long-term investments without fear of suddenly losing their fiscal foundation. These efforts could and should include experimenting with new types of training, opening up training support to more workers, and modernizing system IT infrastructure — made possible by stronger and more reliable funding.
Conclusion
The erosion of federal workforce development funding has left American workers in a vulnerable position entering an era of unprecedented technological change. That decline, coupled with state distribution formulas that rely on volatile metrics, has forced workforce agencies and local boards to triage their intensive career and training services. It has become harder for agencies to test new interventions, let alone make existing training programs widely available to workers. At the same time, weak funding levels have prevented agencies from adopting more sophisticated and streamlined technology systems.
Congress should look to restore workforce funding to levels seen at the outset of the 21st century — and beyond. Labor market shifts in the age of AI could be swift and complex. Workforce agencies need the resources to support a wide range of workers who come in the door, and to experiment with new training supports and service delivery. More robust funding must be coupled with reliable distribution formulas based on the overall size of the workforce.
The cost of inaction is a workforce ill-equipped for change. By prioritizing WIOA financing reforms, Congress can ensure that every American worker — no matter the industry or occupation — has a reliable pathway to the jobs of the future.
Appendix A: Program funding distribution formulas for states during WIOA era
| Program | Primary formula | Minimum (as a % of prior year funding level) | Maximum (as a % of prior year funding level) |
| Youth |
|
90% | 130% |
| Adult |
|
90% | 130% |
| Dislocated Worker |
|
90% | 130% |
| Employment Service |
|
90% | – |
Source: U.S. Department of Labor Employment and Training Administration.65
Note: The Dislocated Worker program lacked stop-loss and stop-gain measures under WIA. The other programs have had similar measures under WIA and WIOA. The stop-loss measures include additional provisions, but those details have been omitted here.
- Ben Casselman, Economists Once Dismissed the A.I. Job Threat, but Not Anymore (New York, NY: The New York Times, April 3, 2026).
- Brent Orrell, Greg Wright, Harry Holzer, Rachel Lipson, and David J. Deming, What works in workforce development—and how can it work better? (Washington, DC: American Enterprise Institute, March 2023); Laura R. Peck et al., A Meta-Analysis of 46 Career Pathways Impact Evaluations (Washington, DC: U.S. Department of Labor, January 2022).
- Peter Z. Schochet, John Burghardt, and Sheena McConnell, Does Job Corps Work? Impact Findings from the National Job Corps Study, prepared for the U.S. Department of Labor (Washington, DC: Mathematica, December 2008).
- This includes research from Burning Glass Institute about the efficacy of non-degree credentials. While many of these credentials lack value, researchers at BGI determined that around a third of these programs produce wage gains or horizontal transitions into new, upwardly mobile occupations. See: Stuart Andreason, Shrinidhi Rao, Scott Spitze, and Debbie Wasden, Measuring What Matters: A New Framework for Evaluating Non-Degree Credential Quality (Bala Cynwyd, PA: Burning Glass Institute, February 2026).
- Benjamin Hyman, Can Displaced Labor Be Retrained? Evidence from Quasi-Random Assignment to Trade Adjustment Assistance (Chicago, IL: University of Chicago, November 2018).
- Benjamin G. Hyman, Benjamin Lahey, Karen Ni, and Laura Pilossoph, How re-trainable are AI-exposed workers? (Cambridge, MA: National Bureau of Economic Research, May 2026).
- Julian Jacobs and Jordan Canedy, Did US Worker Retraining Reduce Participant Automation Exposure? (University of Oxford, Google DeepMind, and Forecasting Research Institute, May 2026).
- National Association of State Workforce Agencies (NASWA) and the National Association of Workforce Boards (NAWB), A Changing Workforce Development Landscape: The Current State of Data Technology Systems and Preparing for What Lies Ahead (Washington, DC: NASWA and NAWB, June 2018).
- Testimony of Harry J. Holzer on federal funding for workforce development, Before the Committee on Education and Labor, Subcommittee on Higher Education and Workforce Development, 118th Congress (2023) (Testimony by Harry J. Holzer, Georgetown University McCourt School of Public Policy).
- National Association of State Workforce Agencies (NASWA) and the National Association of Workforce Boards (NAWB), A Changing Workforce Development Landscape: The Current State of Data Technology Systems and Preparing for What Lies Ahead.
- Employment and Training Administration, Workforce Innovation and Opportunity Act (WIOA) and Wagner-Peyser Act Statutory Formulas for State Allotments (Washington, DC: U.S. Department of Labor, 2023).
- 20 CFR 683.120.
- National Association of Workforce Boards, Total number of workforce development boards (Washington, DC: NAWB, 2025).
- Dana Gentry, Nevada spent $15 million to help 350 people find jobs (Nevada: Nevada Current, February 22, 2024).
- Kate Dunham, Melissa Mack, Caitlin Grey, Mary Hancock, Pamela Holcomb, Brittany English, and Grace Roemer, Operationalizing Changes to the Title I Youth Program Under WIOA, Submitted to the U.S. Department of Labor’s Chief Evaluation Office (Washington, DC: Social Policy Research Associates and Mathematica, November 2020).
- Adam K. Edgerton, Job Corps: A Primer (Washington, DC: Congressional Research Service, August 2022).
- Anne Chamberlain, Clancy Bertane, Jessica Cadima, Matthew Darling, Andreana Kenrick, and Jaclyn Lefkowitz, Study of the American Job Center Customer Experience, Submitted to the U.S. Department of Labor’s Chief Evaluation Office (Columbia, MD: IMPAQ International and Ideas42, December 2017).
- Benjamin Collins, The Workforce Innovation and Opportunity Act and the One-Stop Delivery System (Washington, DC: Congressional Research Service, September 2022); Sam Hammond, Unwinding the Long Great Society (Washington, DC: The American Conservative, January 2023).
- Lori Frazier Bearden, Training and Employment Guidance Letter No. 05-25 (Washington, DC: U.S. Department of Labor Employment and Training Administration, November 2025).
- Will Raderman, Establishing unemployment insurance as a true worker benefit (Washington, DC: Niskanen Center, September 2023).
- Funding for key workforce programs found in Title I of WIOA has eroded. This decline has only been partially offset by funding increases for RESEA (Reemployment Services and Eligibility Assessments), which has become a prominent program available to a subset of workers approved for unemployment insurance. See: Lori Frazier Bearden, Training and Employment Guidance Letter No. 14-24 (Washington, DC: U.S. Department of Labor, June 2025).
- 20 CFR Part 680 Subpart E.
- 20 CFR 683.205.
- National Governors Association, State and Territory WIOA Title I Allocations Since 2014 (Washington, DC: NGA, December 2023).
- Will Raderman, Getting the job done on unemployment insurance: How Congress can reinforce program administration and integrity with finance reform (Washington, DC: Niskanen Center, April 2024).
- Note: This includes the Job Corps program. Per the Congressional Research Service, Job Corps is not considered a core WIOA program and therefore not discussed in detail in this report. See: Adam K. Edgerton, Job Corps: A Primer; Benjamin Collins, The Workforce Innovation and Opportunity Act and the One-Stop Delivery System.
- The departments of Education, Health and Human Services, and Urban Development also have programs with coordinated support at these locations.
- Benjamin Collins, The Workforce Innovation and Opportunity Act and the One-Stop Delivery System.
- Employment and Training Administration, WIOA Adult and Dislocated Worker Program (Washington, DC: U.S. Department of Labor, 2025).
- Congressional Research Service, Dislocated Worker Activities in the Workforce Innovation and Opportunity Act (WIOA) (Washington, DC: CRS, May 2020).
- Portia Wu, Training and Employment Guidance Letter WIOA No. 8-15 (Washington, DC: U.S. Department of Labor Employment and Training Administration, November 2015); U.S. Department of Labor, Approved WIOA Waivers by Waiver Type (Washington, DC: U.S. DOL, January 2025); 20 CFR 681.410.
- Kate Dunham, Melissa Mack, Caitlin Grey, Mary Hancock, Pamela Holcomb, Brittany English, and Grace Roemer, Operationalizing Changes to the Title I Youth Program Under WIOA.
- Employment and Training Administration, Workforce Innovation and Opportunity Act (WIOA) and Wagner-Peyser Act Statutory Formulas for State Allotments (2023).
- Rosemary Lahasky, Training and Employment Guidance Letter No. 14-17 (Washington, DC: U.S. Department of Labor Employment and Training Administration, April 2018).
- 80% of the total appropriation for the Dislocated Worker program is provided to states. The other 20% is set aside for a national reserve fund. See: Congressional Research Service, Dislocated Worker Activities in the Workforce Innovation and Opportunity Act (WIOA).
- Employment and Training Administration, Workforce Innovation and Opportunity Act (WIOA) and Wagner-Peyser Act Statutory Formulas for State Allotments (2023).
- Benjamin Collins, The Workforce Innovation and Opportunity Act and the One-Stop Delivery System.
- 20 CFR Part 683 Subpart A; Employment and Training Administration, Estimated FUTA Receipts vs. Amounts Returned (Washington, DC: U.S. Department of Labor, 2025).
- 29 U.S. Code § 49f.
- Employment and Training Administration, Wagner-Peyser Act of 1933, as amended (Washington, DC: U.S. Department of Labor, 2025).
- The remaining 3% of funds go to states with small labor force sizes that would otherwise see a decline in funding. If there are leftover funds afterward, larger states set to see a reduction in funding will receive a share too. See: Employment and Training Administration, Workforce Innovation and Opportunity Act (WIOA) and Wagner-Peyser Act Statutory Formulas for State Allotments (2023).
- 113th Congress, Workforce Innovation and Opportunity Act; Employment and Training Administration, Program Year 2019 WIOA Performance Summary: WIOA Adult Performance Report (Washington, DC: U.S. Department of Labor, 2021); Employment and Training Administration, Program Year 2024 WIOA Performance Summary: WIOA Adult Statewide Performance Report (Washington, DC: U.S. Department of Labor, 2025).
- The WIOA Youth funds for each program year are provided all at once, while WIOA Adult and Dislocated Worker allotments are supplied over the course of two allotments. See: José Javier Rodríguez, Training and Employment Guidance Letter No. 12-23 (Washington, DC: U.S. Department of Labor Employment and Training Administration, May 2024).
- Employment and Training Administration, State Statutory Formula Funding: WIOA and WP-ES Program Year Allotment Formula Description (Washington, DC: U.S. Department of Labor, 2025).
- Figure reflects initial program year allotments. Additional appropriations nor rescissions made during the course of a year are not included.
- Although RESEA expanded and helped offset some of this decline, its FY 2025 funding level was $388 million. See: Lori Frazier Bearden, Training and Employment Guidance Letter No. 14-24 (Washington, DC: U.S. Department of Labor, June 2025).
- Christopher J. O’Leary and Randall W. Eberts, The Wagner-Pagner-Peyser Act and U.S. Employment Service: Seventy-Five Years of Matching Job Seekers and Employers (Kalamazoo, MI: W.E. Upjohn Institute for Employment Research, December 2008).
- The importance of the funding level is apparent in recent DOL budget submissions. According to the DOL officials, fulfilling the requested amount would make employment and training services available to more workers. See: U.S. Department of Labor, FY 2024 Budget in Brief (Washington, DC: U.S. DOL, 2024); U.S. Department of Labor, FY 2025 Budget in Brief (Washington, DC: U.S. DOL, 2025).
- Benjamin Collins, The Workforce Innovation and Opportunity Act and the One-Stop Delivery System.
- Christopher J. O’Leary and Randall W. Eberts, The Wagner-Pagner-Peyser Act and U.S. Employment Service: Seventy-Five Years of Matching Job Seekers and Employers.
- Joseph B. Fuller, Kerry McKittrick, Nathalie Gazzaneo, Ariel Higuchi, Justine Gluck, Zoe Butler, Jack Porter, and Malena Dailey, Governors Reshaping Workforce Development: Turning WIOA Challenges into Workforce Solutions (Washington, DC: NGA, April 2025).
- Matt Darling, The Tinder-ization of the job market (Washington, DC: The Argument, March 2026).
- 20 CFR § 683.205.
- Administrative costs from the Employment Service at one-stop centers don’t count towards this limit. See: 20 CFR Part 683 Subpart B.
- Employment and Training Administration, Wagner-Peyser Act of 1933, as amended.
- 20 CFR Part 678 Subpart E.
- This is much more of a problem for Title I programs than the Employment Service, as discussed in this section.
- Benjamin Collins, Analysis of the Adult Activities Allotment Formula under the Workforce Innovation and Opportunity Act (Washington, DC: Congressional Research Service, June 2024).
- National Governors Association, State and Territory WIOA Title I Allocations Since 2014.
- Anne Chamberlain, Clancy Bertane, Jessica Cadima, Matthew Darling, Andreana Kenrick, and Jaclyn Lefkowitz, Study of the American Job Center Customer Experience.
- Employment and Training Administration, Workforce Investment Act (WIA) and Wagner-Peyser Act Statutory Formulas for State Allotments (Washington, DC: U.S. Department of Labor, 2008); Employment and Training Administration, Workforce Investment Act (WIA) and Wagner-Peyser Act Statutory Formulas for State Allotments (Washington, DC: U.S. Department of Labor, 2013).
- Employment and Training Administration, Workforce Innovation and Opportunity Act (WIOA) and Wagner-Peyser Act Statutory Formulas for State Allotments (2023).
- Benjamin Collins, Analysis of the Adult Activities Allotment Formula under the Workforce Innovation and Opportunity Act.
- Employment and Training Administration, Workforce Innovation and Opportunity Act (WIOA) and Wagner-Peyser Act Statutory Formulas for State Allotments (2023).
- Employment and Training Administration, Workforce Innovation and Opportunity Act (WIOA) and Wagner-Peyser Act Statutory Formulas for State Allotments (2023).