
Policy Design Outweighs Messaging: Results From a Survey Experiment

There is a sense, both in advocacy organizations and campaigns across the country, that messaging matters more than policy substance. The thinking is that, so long as politicians use colorful language and appeal to voters’ core values, they can sell voters on any policy within limits.
The Searchlight Institute conducted an experiment to test this very hypothesis. Contrary to popular belief, the data tell us that there is only so much that messaging can do to persuade voters to support an unpopular policy. Instead, voters are more likely to support popular policies despite the messaging, rather than because of it.
Experiment Design and Results
We tested twelve policies across four main topics within the social safety net: SNAP, Social Security, child allowance, and unemployment insurance. We tested four distinct supporting messages for each policy, but only one opposed message so we could cleanly compare the effects of different supportive messages. Each respondent saw every policy, but only one supporting argument per policy, with the same opposing message for each policy shown to all respondents (see Appendix for exact wording). We were then able to compare message effects within policies as well as between policies under each umbrella. This is a different design than a formal RCT, as we have no “control” option. Instead, our analysis uses the average support across messages as a quasi-control.
The results show that while there are certainly messaging effects on whether voters will support or oppose a proposed policy, the effects of the contents of the policy are much stronger than the messaging effects.
We ran an ANOVA variance decomposition to see whether the variance in argument support scores is statistically significant. We divided the variation in scores into two different categories: 74% of the policy score variation came from which policy was being discussed and 26% came from which argument was being made. While the messaging around a policy certainly affects its popularity, the content of the policy matters approximately three times more.
We do find that some policies have stronger messaging effects than others, which may be related to the malleability of the policy, or to the strength of the messages. SNAP, for example, had support ranges of up to 12 points per policy. One notable messaging outlier was a frame for a child allowance to single fathers emphasising fairness for men, which pushed support to 65% from the average of 53%. Given the sample sizes, we are inclined to treat this as an outlier, but it is also an interesting hook for future research on the effectiveness of frames diverging from the typical social program messaging.
The F-statistic tests whether the differences in scores across policies are truly different or just random variation that we would expect in any kind of survey data. We find F = 12.78 and p < 0.0001, meaning that the probability that these differences happened by random chance is less than 1 in 10,000. For comparison, the conventional threshold for finding something statistically significant is p < 0.05. We’ve uploaded the code and csv so that this test can be replicated.
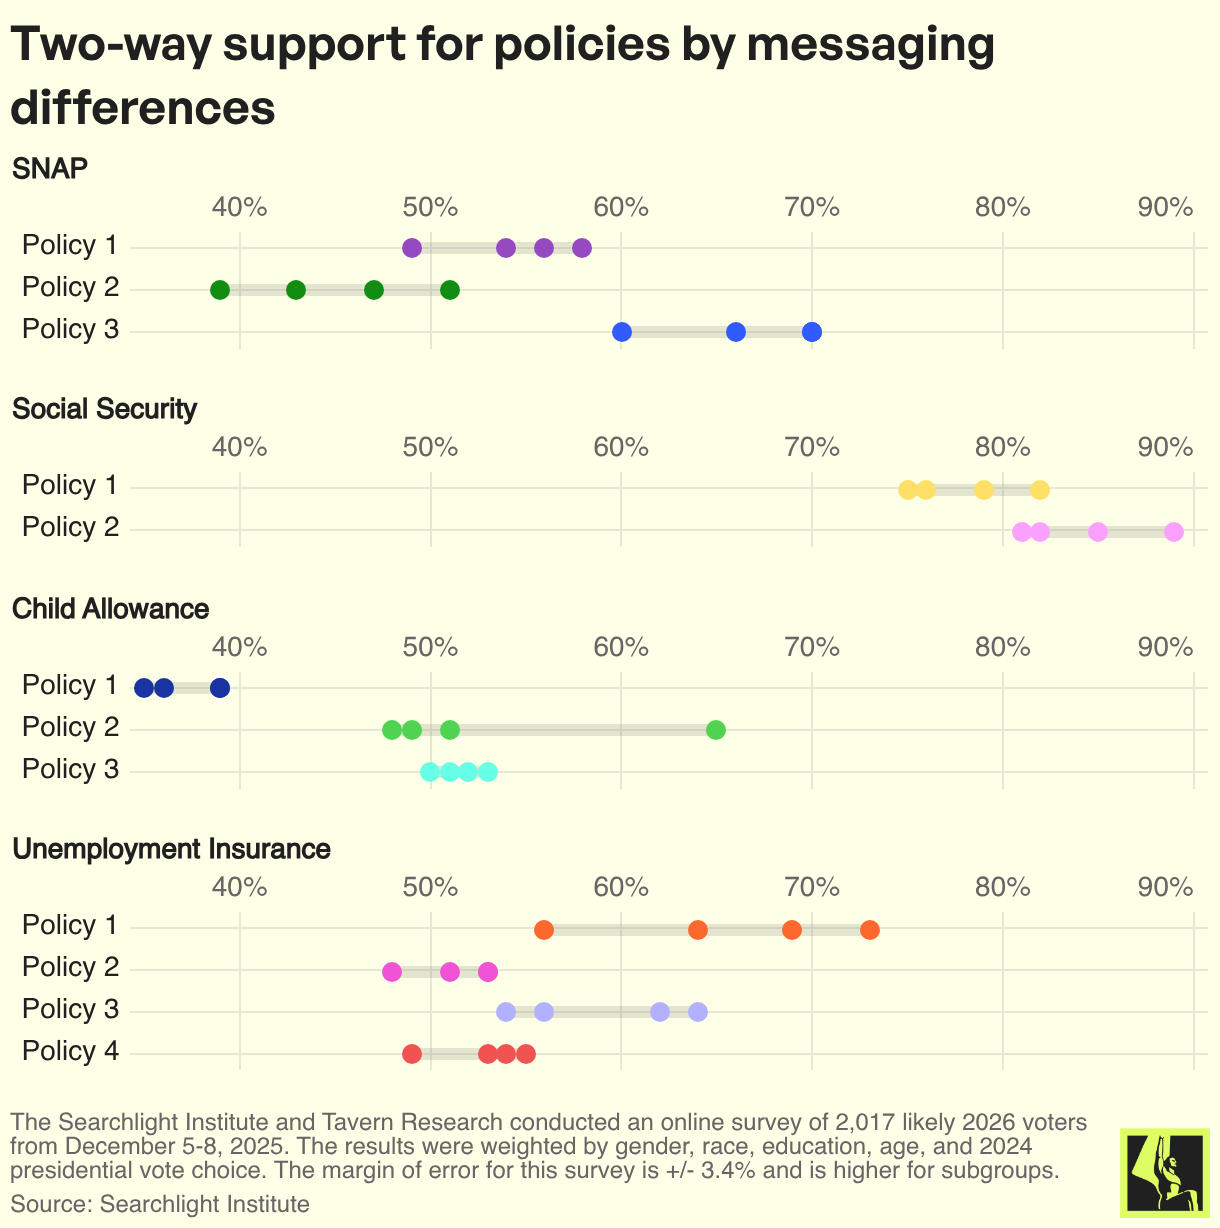
SNAP: We tested three different policies surrounding SNAP. The supporting messages had an impact on each policy’s two-way support. Expanding access to more families (policy 1) had a support range across messages of 9-points from 49% support to 58%. Expanding access to families with young children (policy 2) had a support range of 12-points from 39% to 51%. Increasing benefits (policy 3) had a support range of 10-points from 60% to 70%. Meanwhile, the range in average support for each policy was 22 points, from 45% (policy 2) to 67% (policy 3). The range in support is larger from policy to policy than it is from message to message.
Social Security: We tested two different Social Security policies. Both policies were very popular regardless of messaging. Average support for policy 1 was 78% and average support for policy 2 at 84%. Despite different messaging, the support ranges for these policies were not particularly wide, with a range of 7-points (from 75% to 82%) for increasing Social Security Disability Insurance payments and 8-points (from 81% to 89%) for increasing Social Security payments. For this policy area, the messaging effects closely matched the policy effects. The range in policy effects was 6-points, compared with the 7 and 8-point messaging effects within each policy.
Child Allowance: Our three child allowance policies have the largest differences in their average support. While the ranges in support for two of the three of these policies are relatively small, the range of their average support is much larger. Giving all households with children under 18 a monthly allowance (policy 1) has a range of 4-points (from 35% to 49%). Giving single father households a monthly allowance (policy 2) has a range of 17-points (from 48% to 65%). Giving single mother households a monthly allowance (policy 3) has a range of 3-points (from 50% to 53%). The larger range within policy 2 is largely due to an outlier in message two, which resulted in 65% support. When we take the range in support without that data point into account, the range shrinks to 3-points, which matches the ranges in message effects for policy 1 and policy 3. While the ranges within the messaging effects are relatively small, there is a 16-point range in the average support from policy 1 (37%) to policy 2 (53%). The drastic jump between the least popular policy and most popular policy highlights the effect of the policy’s content on average support.
Unemployment Insurance: We tested four unemployment insurance policies. Allowing people to enroll in education and training programs while receiving unemployment (policy 1) has a support range of 17-points (56% to 73%). Allowing unemployed workers to claim certain family members as dependents (policy 2) has a range of 5-points (48% to 53%). Raising unemployment benefits by $150 per week (policy 3) has a range of 10-points (54% to 64%). Allowing people to claim unemployment for 39 weeks instead of the current 26 weeks has a range of 6-points (48% to 55%). The range in average support from policy to policy is 15-points (from 51% for policy 2 to 66% for policy 1). Once again, we see a much larger effect on support from the policy proposal than from the support message that any given respondent saw.
Appendix: Full Messages and Results
SNAP POLICY
SNAP Policy 1:
A family of four earning up to $62,400 would receive food assistance benefits through the federal SNAP program, compared to the current limit of $40,560. These newly eligible households would receive an average of $200 per household per month in food assistance. This would cost about $28.8 billion each year, and would be funded by a new 1% national sales tax on all purchases.
Oppose message: This policy gives food stamps to middle-class families who can afford groceries on their own and reduces the incentive to work harder or earn more when the government provides for you regardless.
| Support Message | Two-Way Support | Average Policy Two-Way Support |
| Extending SNAP to working families earning up to $62,400 prevents the cliff effect where a small raise causes families to lose all benefits and actually become worse off financially. | 49% | 54% |
| Hard working families shouldn’t have to choose between paying rent and feeding their children – we must ensure work provides a pathway out of poverty, not into it. | 54% | 54% |
| Supporting working families with food assistance helps them remain employed and productive, reducing turnover costs for businesses and maintaining stable communities. | 58% | 54% |
| Working families struggling with high costs deserve support too – this policy recognizes that many people work full time but still can’t afford adequate food for their children. | 56% | 54% |
SNAP Policy 2:
All families with children under age 5 would receive $200 per month in food assistance from the federal SNAP program, regardless of income. This would cost about $36 billion each year, and would be funded by raising income taxes by 37% to 42.5% on income over $400,000 per year.
Oppose message: This policy wastes taxpayer money giving food stamps to high-income families who don’t need help, while making more people dependent on the government instead of encouraging self-reliance.
| Support Message | Two-Way Support | Average Policy Two-Way Support |
| All young children deserve a fair start in life regardless of their parents’ income – this policy treats every child as equally worthy of support. | 47% | 45% |
| Investing in early childhood nutrition reduces future healthcare costs, improves educational outcomes, and creates healthier, more productive adults who contribute to the economy. | 51% | 45% |
| Universal food assistance for families with young children ensures every child gets adequate nutrition during critical developmental years when their bodies and brains are forming. | 39% | 45% |
| We have a moral obligation to ensure no child suffers from malnutrition or hunger during the most important years of their development. | 43% | 45% |
SNAP Policy 3:
People who receive food assistance through the federal SNAP program would receive an additional $75 per person per month. The average recipient currently receives $187 per person per month. This would add about $37.5 billion to the deficit each year.
Oppose message: This policy creates more dependency on government handouts rather than helping people find jobs and support themselves, trapping families in poverty instead of giving them a path to self sufficiency.
| Support Message | Two-Way Support | Average Policy Two-Way Support |
| Access to sufficient food is a basic human right – this policy treats struggling families with dignity by ensuring they can feed themselves and their children without shame. | 60% | 67% |
| Every dollar in additional SNAP benefits generates more economic activity at grocery stores, farmers markets, and food retailers, supporting jobs throughout the food system. | 70% | 67% |
| No child in America should go to bed hungry – we have a moral responsibility to ensure families can put adequate food on the table. | 70% | 67% |
| This increase ensures families can afford adequate nutrition during difficult economic times, preventing hunger and food insecurity that threatens their stability | 66% | 67% |
CHILD ALLOWANCE POLICY
Child Allowance Policy 1:
All families would receive $250 per month (i.e. $3000 per year) per child under 18, regardless of income. This would add about $219.3 billion to the deficit each year.
Oppose message: This policy gives government checks to billionaires and millionaires who don’t need them while creating a massive new dependency that discourages work and requires enormous tax increases on working families.
| Support Message | Two-Way Support | Average Policy Two-Way Support |
| A universal child allowance ensures all families have resources to cover basic costs of raising children – food, clothing, school supplies, and childcare – reducing financial stress on parents. | 36% | 37% |
| Every child deserves a strong start regardless of their parents’ income – this policy treats all children as equally worthy of investment and support. | 35% | 37% |
| Providing cash directly to families with children stimulates the economy as parents spend on necessities, supporting local businesses while helping families thrive. | 39% | 37% |
| Raising children benefits all of society, not just individual families – we have a collective responsibility to ensure every child has what they need to succeed. | 39% | 37% |
Child Allowance Policy 2:
Single-father households would receive $250 per month (i.e. $3000 per year) per child under age 18, regardless of income. This would cost about $9.2 billion each year, and would be funded by a new 1% national sales tax on all purchases.
Oppose message: This policy discriminates by giving benefits only to single fathers while denying them to single mothers and married couples, picking winners and losers based on gender and family structure.
| Support Message | Two-Way Support | Average Policy Two-Way Support |
| Children deserve support regardless of whether they’re raised by single mothers or single fathers – family structure shouldn’t determine a child’s opportunity to thrive. | 49% | 53% |
| Single fathers face the same economic challenges as single mothers when raising children alone – this allowance provides essential support for housing, childcare, and expenses that keeps families stable. | 65% | 53% |
| Single fathers work hard to provide for their children and deserve recognition and support for taking on the full responsibility of raising kids without a coparent. | 51% | 53% |
| Supporting single-father families prevents child poverty and creates better outcomes for children, which benefits communities and the economy in the long run. | 48% | 53% |
Child Allowance Policy 3:
Single-mother households would receive $250 per month (i.e. $3000 per year) per child under age 18, regardless of income. This would cost about $45.3 billion each year, and would be funded by raising income taxes from 37% to 43.9% on income over $400,000 per year.
Oppose message: This policy encourages couples to exploit the system by avoiding marriage or staying separated just to qualify for government benefits.
| Support Message | Two-Way Support | Average Policy Two-Way Support |
| Children in single-mother households shouldn’t face poverty because of their family structure – we have a moral duty to ensure all children have what they need regardless of circumstances. | 51% | 51% |
| Single mothers face unique economic challenges raising children alone – this allowance provides critical financial security for housing, childcare, and daily expenses that determine whether families stay afloat. | 50% | 51% |
| Single mothers work incredibly hard to provide for their children and deserve support that recognizes the challenges of raising kids without a co-parent’s income or help. | 53% | 51% |
| Supporting single-mother families reduces child poverty, improves educational outcomes, and creates more economically stable adults, generating long-term returns for society. | 52% | 51% |
SOCIAL SECURITY POLICY
Social Security Policy 1:
People who receive Social Security Disability Insurance would receive an additional $150 per month. The average recipient currently receives $1,583 per month. This would cost about $14.6 billion each year, and would be funded by raising income taxes from 37% to 39.2% on income over $400,000 per year.
Oppose message: This policy expands disability benefits without addressing widespread fraud and abuse in the system, rewarding people who game the program while burdening working Americans who fund it.
| Support Message | Two-Way Support | Average Policy Two-Way Support |
| It is our moral duty to support those who cannot work due to circumstances beyond their control, ensuring they have the resources to live safely and maintain their health. | 75% | 78% |
| People with disabilities deserve to live with dignity – this increase recognizes their worth and ensures they can participate in their communities without living in poverty. | 79% | 78% |
| This increase provides critical economic security for people who can no longer work due to disability, helping them afford medical care, accessible housing, and daily living expenses. | 82% | 78% |
| When people with disabilities have adequate income, they can afford assistive technology, transportation, and services that allow them to remain active consumers in the economy. | 76% | 78% |
Social Security Policy 2:
Retirees who receive Social Security benefits would receive an additional $200 per month. The average recipient currently receives $2,008 per month. This would add about $128 billion to the deficit each year.
Oppose message: This policy accelerates Social Security’s path to insolvency and burdens future generations with massive debt for a program that’s already going bankrupt instead of fixing its fundamental problems.
| Support Message | Two-Way Support | Average Policy Two-Way Support |
| After decades of contributing to Social Security, retirees deserve adequate benefits that reflect today’s cost of living and allow them to maintain dignity in their retirement years. | 89% | 84% |
| Increasing Social Security benefits for seniors puts money directly into local communities – retirees spend on groceries, medications, and services, supporting jobs and economic growth. | 82% | 84% |
| This increase ensures economic security for seniors who worked their entire lives and now face rising costs for housing, healthcare, and basic necessities. | 81% | 84% |
| We have a moral obligation to ensure that seniors who built this country can afford food, medicine, and shelter without choosing between necessities. | 85% | 84% |
UNEMPLOYMENT INSURANCE POLICY
Unemployment Insurance Policy 1:
Unemployed workers could enroll in education and training programs while receiving their standard unemployment benefits of $387 per week for 26 weeks, plus an additional $200 per month for books and materials. This would cost about $2 billion each year, and would be funded by a new 1% national sales tax on all purchases.
Oppose message: This policy turns unemployment benefits into free college for people who should be actively looking for work, keeping them out of the job market while taxpayers fund their education.
| Support Message | Two-Way Support | Average Policy Two-Way Support |
| Allowing workers to pursue training while receiving benefits helps them gain new skills for better jobs, providing long-term economic security rather than forcing them into dead-end positions. | 73% | 66% |
| Investing in worker retraining during unemployment creates a more skilled workforce that attracts better-paying employers and strengthens the overall economy. | 69% | 66% |
| We have a responsibility to help workers adapt to changing economies – supporting education during unemployment transforms temporary setbacks into opportunities for growth. | 56% | 66% |
| Workers deserve the opportunity to improve their circumstances – this policy treats job loss as a chance for advancement rather than just a crisis to survive. | 64% | 66% |
Unemployment Insurance Policy 2:
Unemployed workers could extend benefits to certain family members (grandparents, aunts, uncles, adult siblings) who depend on them and live in their household. The worker would receive an additional $100 per week per dependent, up to two dependents. This would cost about $1.5 billion each year, and would be funded by raising taxes from 37% to 37.2% on income over $400,000 per year.
Oppose message: This policy expands welfare to adult relatives who should be working themselves and makes fraud too easy by rewarding people for claiming dependents who may not actually rely on them.
| Support Message | Two-Way Support | Average Policy Two-Way Support |
| All types of families deserve support – this policy treats non-nuclear families with the same dignity and recognition as traditional nuclear families. | 53% | 51% |
| Supporting extended family households during unemployment prevents the need for more expensive emergency assistance later, like homeless shelters or emergency medical care. | 48% | 51% |
| This extension recognizes modern family structures where grandparents, aunts, uncles, and siblings often depend on a worker’s income, providing security for these households during unemployment. | 53% | 51% |
| We should honor all caregiving relationships – many workers support elderly parents or disabled siblings, and these families deserve protection during job loss. | 51% | 51% |
Unemployment Insurance Policy 3:
Unemployed workers would receive an additional $150 per week for 26 weeks. The average recipient currently receives $387 per week. This would add about $15.6 billion to the deficit each year.
Oppose message: This policy pays people more to stay home than to work, discouraging job seeking and making it harder for businesses to find workers while punishing those who stayed employed.
| Support Message | Two-Way Support | Average Policy Two-Way Support |
| Adequate unemployment benefits maintain consumer spending during economic downturns, supporting businesses and jobs that would otherwise be lost in a downward spiral. | 54% | 59% |
| Increasing weekly benefits ensures unemployed workers can continue paying rent, utilities, and other essential expenses while searching for new employment, preventing homelessness and evictions. | 62% | 59% |
| People who lose their jobs shouldn’t immediately face financial ruin – we must provide a safety net that allows families to maintain stability during temporary setbacks. | 64% | 59% |
| Workers who paid into unemployment insurance throughout their careers deserve benefits that actually cover basic living costs, not poverty-level payments that force impossible choices. | 56% | 59% |
Unemployment Insurance Policy 4:
Unemployed workers would receive unemployment benefits for up to 39 weeks instead of the current 26 weeks. The average weekly benefit is $387. This would cost about $10 billion each year, and would be funded by a new 1% national sales tax on all purchases.
Oppose message: This policy to extend unemployment benefits means people will stay unemployed for longer since they won’t look for a job until their benefits run out.
| Support Message | Two-Way Support | Average Policy Two-Way Support |
| Extending benefits to 39 weeks provides economic security for workers who need more time to find a job that matches their skills, preventing families from falling into poverty during job searches. | 55% | 52% |
| Longer unemployment benefits allow workers to search for appropriate jobs rather than taking mismatched positions, reducing turnover and helping workers find more stable employment. | 49% | 52% |
| We have an obligation to support workers during difficult transitions between jobs to prevent families from falling into poverty during job searches. | 54% | 52% |
| Workers who lost their jobs through no fault of their own deserve adequate time to find quality employment without being forced to accept the first low-wage job out of desperation. | 53% | 52% |