
How To Build A Supermajority: Go Beyond Partisanship
Introduction
It’s not Democrats on one side and Republicans on the other, both equally homogeneous in their views. Rather, the vast majority of American voters have a heterodox mix of opinions, some that lean more conservative and others liberal. It’s rare to find a voter that is ideologically consistent.
In collaboration with our research and methodology partner, the nonpartisan non-profit More in Common, we asked nearly 6,000 voters a comprehensive set of over 200 questions across two polls and two qualitative projects. This allowed us to understand voter preferences in closer detail than a typical poll would allow. Our approach, culminating in a voter segmentation, helps us understand variations within the electorate that we wouldn’t otherwise be able to see.
For example, the following question finds that a large majority of American voters support requiring immigrants to learn English and embrace American culture. In a vacuum, this result would suggest that voters hold traditionally conservative stances on most cultural issues related to immigration.

Now that we have the answers to both a question on assimilation and birthright citizenship, we can analyse how the responses interact together. As shown below, half of the voters who say that immigrants should be required to learn English also support birthright citizenship for all children born in the United States. A conservative position on one cultural question about immigration does not necessarily translate to another conservative position on the very same issue.
Some argue that political party affiliation is the primary lens to understanding voters’ policy beliefs. While this is directionally true, our survey data found that this does not clearly represent the electorate.
For example, take the following question about whether the government should prioritize maintaining law and order or keeping society open and free.

The result clearly shows that maintaining law and order is broadly popular across the entire electorate, especially popular among Republicans. In fact, it would seem there is no coalition that supports keeping society open and free over maintaining law and order.
But we broke the electorate down into nine different ideologically distinct segments (which we will explain below), and found that the results are far more complicated. Even among the groups that create the Republican coalition, there are segments that are either split on the issue or prefer to keep society open and free.

Our Project
We ran a large national survey of 5,807 likely 2028 voters with 93 questions covering a range of policy areas, political topics, and values. We also obtained demographic information such as age, income, and religion. The sample size and breadth of the survey means that we’re able to compare people’s views across topic areas that are usually not represented in one survey. It also means that we have sufficient sample size to segment the American electorate into smaller groups.
These nine segments are based on responses to a set of 16 values-driven questions, which we developed through an iterative testing process. Where a policy attitude tells you where someone stands on a specific issue today, policy value questions ask what people prioritize in governance when two things they care about conflict—security or freedom, individual responsibility or collective support, parental authority or children’s privacy—which tends to be more stable than any single position. We did not use partisanship, ideology, or demographics to build the segments. While they are related to overall ideological temperament, two segments can lean the same ideological direction overall and still answer these tradeoff questions very differently.
However, because those values are related to overall political temperament, and the segments do show distinct variation in ideological lean, this assures us that these segments are realistic groupings of the electorate.
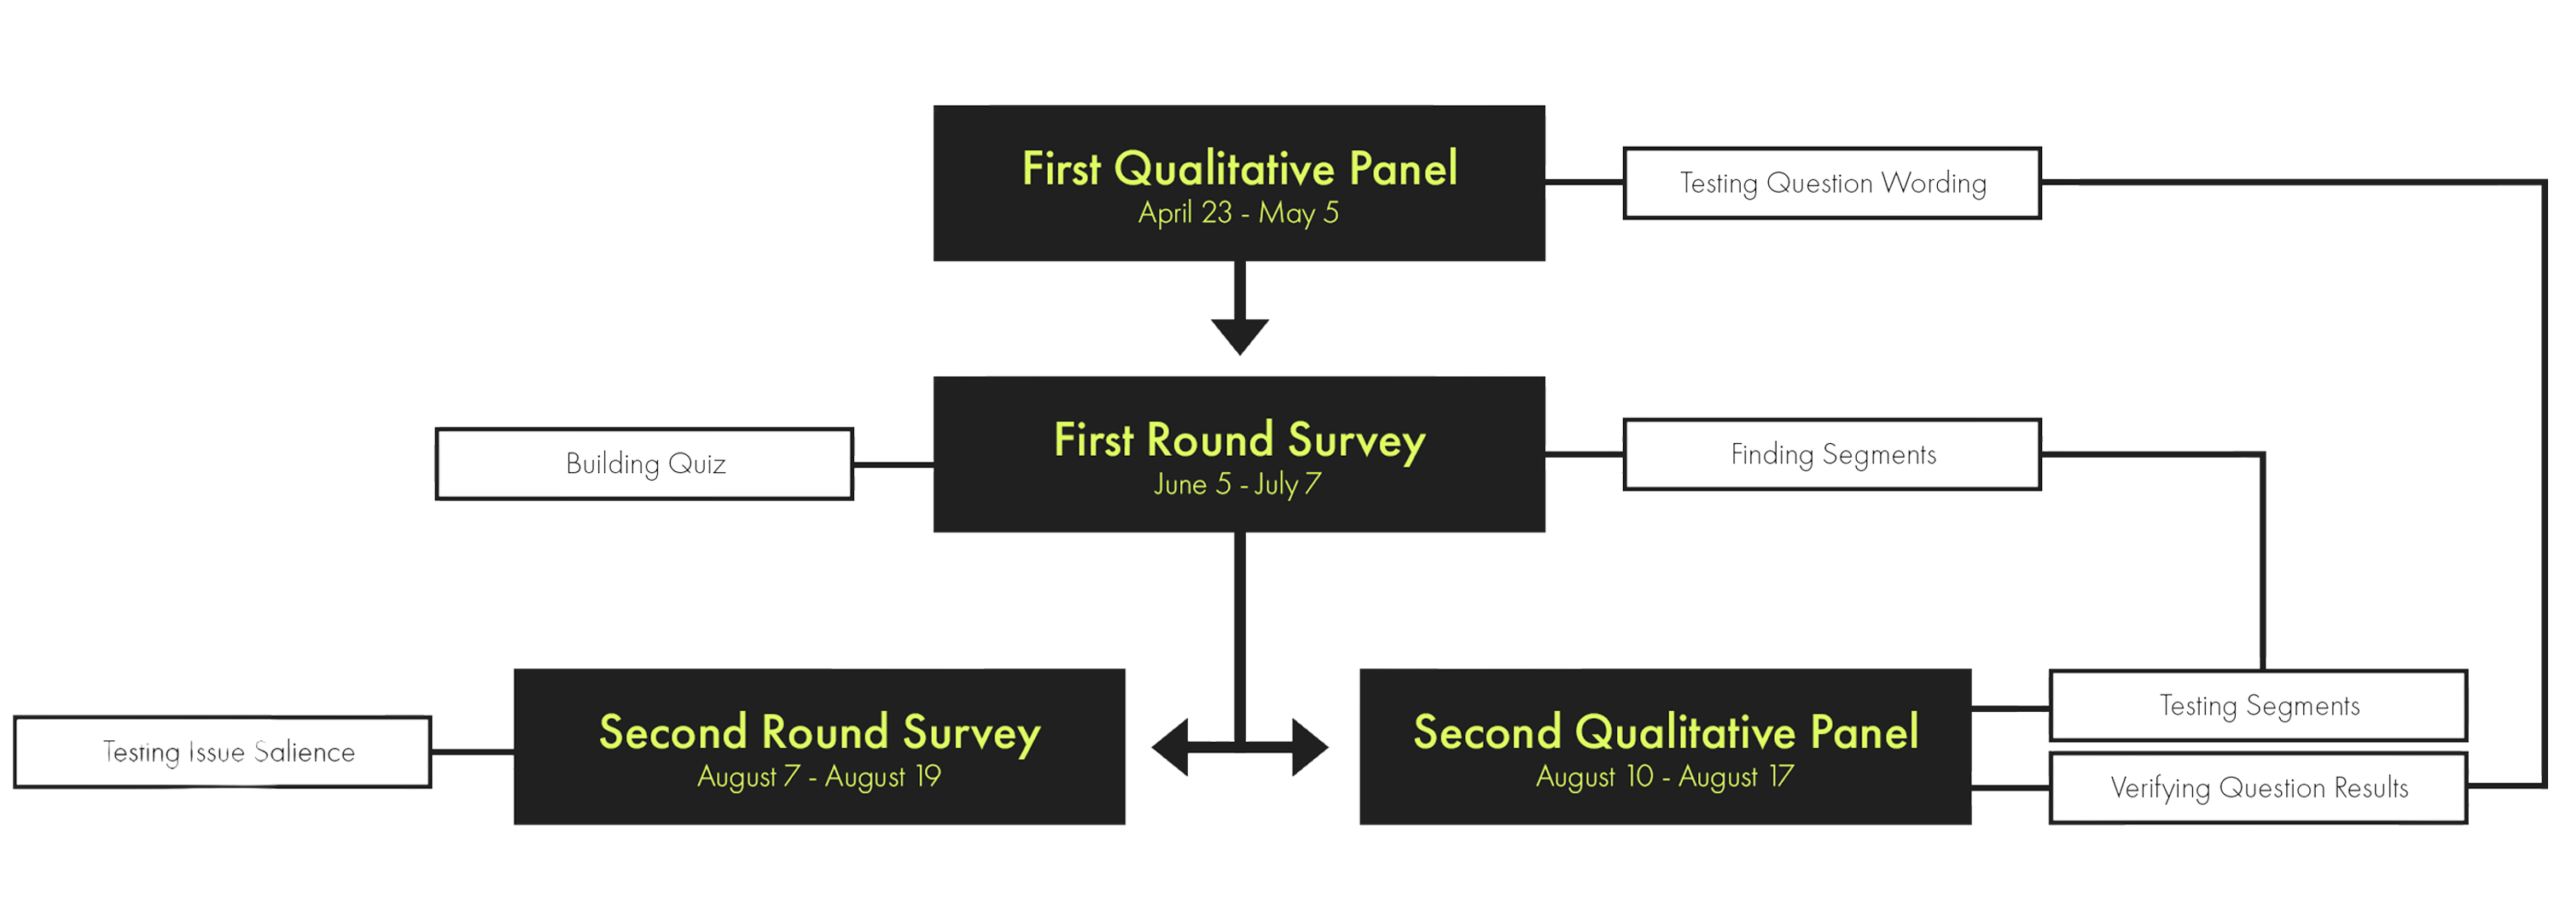
After completing the original analysis, we conducted another round of qualitative and quantitative research. Our segmentation left us with questions about whether the divisions we identified and the groups we were segmenting would replicate. This additional qualitative exercise let us ask open-ended questions, and voters answered in their own words. In all, through both our qualitative and quantitative research, we spoke to more than nine thousand voters in the span of five months.
Round 1 Survey
This was our initial effort to measure opinion across a wide range of issues and values. We put together a list of binary choice questions and asked voters to choose between two positions. We did not include “unsure” or “don’t know” options in order to force people to choose between two (often uncomfortable) choices. We also tested these questions before running them with a qualitative online panel to determine whether questions were confusing or if voters were asked to make false choices, and subsequent edits were made.
Our Social Security question best illustrates why we made this forced choice design. It asked voters to select between A: Increase taxes to fund Social Security at current levels, and B: Reduce Social Security benefits to keep tax levels stable. Neither of these two options is ideal, and the most popular option is going to be a compromise that doesn’t increase taxes or reduce benefits. However, the most illustrative result is what voters would select if they did have to choose. In this case, it turns out that 76% of them chose to raise taxes.
With so many questions, we were able to conduct a variety of analyses to understand the major divisions in the electorate. Partisanship was obviously important, but we wanted to know what would happen if party identification and demographics were excluded, and instead focused purely on the issues.
The method we settled on uses 16 value-driven questions to create 9 segments. We went through an iterative process, looking for a set that would create coherent groupings and explain politically relevant opinions. We preferentially selected values questions over policy questions, with the theory that values will be more stable and robust to current events. A full list can be found in the appendix or in our Political Neighborhoods Quiz.
The Scales
Our expansive survey covered various topics ranging from gender norms to immigration. After analyzing this dataset, we found that labels like Democrat or Republican and conservative and liberal only partially explained the variation in voter behavior. Instead, based on our 16 key segmentation questions, we found that the American electorate breaks down along 5 axes. These are ordered by how strong their effect is in dividing the electorate, but the differences are relatively small.
The electorate breaks down on ideological scales built around the following policy areas:
- Gender and gender roles
- America’s international role
- Parental authority and the family
- Economic role of the government
- Order and openness
These scales are not built from a single policy question, rather from sets of questions that identify the same values and cultural impulses, weighted together. They provide the best differentiation of the electorate we could find. Notably, these scales break the traditional “social axis” into three separate scales, “gender and gender roles”, “parental authority”, and “order and openness”.
The Segments
Using these 5 factors, we can divide the electorate into 9 groups. These groups reflect real underlying differences in values and policy ideas, and provide a more complete understanding of divisions than party identification alone.
Liberal Arts Left: The most ideologically homogeneous and progressive group. They are highly educated, younger, and report being financially unstable.
Lawn Sign Liberals: This group holds conventional progressive opinions on virtually all issues. They differentiate themselves from the Liberal Arts Left because they oppose wealth caps and are comparatively more favorable to a market-based economy.
The Neighborhood Watch: This group is the most racially diverse and supports mainstream progressive views on economic issues, but less so than the most liberal segments. They stand out among the more left-leaning groups in their low societal trust and support for order.
Trad-Digitial: This group is younger, online, and the most ideologically diverse segment — splitting their 2024 vote almost equally. They are relatively progressive on economics and traditional on culture.
The Center Square: This group is the least likely to be registered to vote and has few strong policy priorities. They are very pocketbook focused and oppose any new taxes.
Sticker-shocked Skeptics: This group is older, offline, and not politically engaged. They lean right on culture and vote mainly on pocketbook issues. They are the most likely to regret their vote for Trump because of inflation.
Stars, Stripes, and Steeple: This group is retired, religious, and southern. They are conservative on most economic issues, but stand out among conservatives for supporting humanitarian aid and more government involvement in providing healthcare.
No Trespassing Populists: This group is very conservative on cultural issues and the most supportive of aggressive deportation policy. But they break from conservatives for supporting progressive economic policies like wealth caps.
Cul-de-Sac Conservatives: This is the only group to hold traditional conservative views on all issues, including government involvement in health care. They are the right’s parallel to the Liberal Arts Left.
As shown in the graphs below, the segments are able to color and describe a lot more opinions than partisanship. For example, the chart below illustrates the relationship between voters’ views on gender and the role of the government in the economy. Viewed simply through party ID, there isn’t much room for coalition building, as Republicans appear to be squarely in favor of less government intervention in the economy and support traditional gender norms, while Democrats support the reverse. However, when the nine segments are overlaid on the graph, a more complete understanding of the electorate appears. Many of the segments that build the Republican coalition show a preference for more government intervention in the economy, which means Democratic politicians can make inroads with those segments if they adopt more conservative views on gender.
A similar pattern emerges when we look at the relationship between America’s role in the world and whether domestic order should be preferred over openness. However, the coalition is significantly different. The most liberal segments are split on the order/openness axis, while the Liberal Arts Left and Lawn Sign Liberals prefer to keep society open and free. True to their name, the Neighborhood Watch most prefer to maintain law and order. Even the conservative segments are split, as the Sticker Shocked Skeptics prefer openness, while the Stars, Stripes, and Steeple prefer law and order.
Importantly, there is no single most important axis. Building a supermajority requires a coalition that cuts across all issues.
Round 2 Survey
Our second survey allowed us to measure the salience of each of these issues. We did this by running a conjoint experiment, where respondents saw two hypothetical candidates with randomized positions and then chose their preferred candidate. The conjoint experiment gave us a ranking of how much candidate positions on each issue impacted vote choice.
See our strategy memo for more on this.
Final Qualitative Work
Lastly, we reviewed our segmentation by returning to the field and asking voters questions via an online panel of 316 respondents, with an oversample of Trump voters. This helped us clarify their relative understanding of political topics and the motivation behind their political beliefs. We also verified that our questions were being interpreted correctly. Overall, the responses backed our initial segmentation.
The qualitative data further demonstrates the heterodoxy of the American electorate. For example, one respondent, from our “Lawn Sign Liberals” group, expressed mostly liberal beliefs. But when asked about eligibility for welfare benefits, she said: “The people who aren’t trying shouldn’t get help.” This demonstrates her divergence from the “Liberal Arts Left” segment due to her focus on responsibility.
Another interesting trend was that our most ideologically consistent segments tended to bring up abstract political ideas, like democracy or fiscal conservatism, while our more heterodox segments focused on practical impacts on their everyday life.
Overall, our qualitative work was important for verifying that our segments are realistic groupings of the American electorate and because it allowed us to hear voter heterodoxy defined in their own words.
Conclusion
During our eight-month project, we received data from nearly 9,000 voters. This included a comprehensive set of over 200 questions across two polls and two qualitative projects. While no voter segmentation will fully encapsulate the ideological diversity of the American electorate, our expansive surveys allowed us to create nine realistic groupings of voters. We are confident that this is the best way to understand American voters.
The most important finding from this work is that only 10% of the electorate is completely ideologically liberal and 14% is completely ideologically conservative. The rest of America holds heterodox beliefs on various political issues and values.
This work should be used to inform any politician, political strategy, or pundit who seeks to understand how to build a political coalition and platform that will best represent the American electorate.
Appendix
Questions Used For Segmentation
Every question uses the same 6-point answer scale:
1 = Fully agree with A
2 = Mostly agree with A
3 = Lean toward A
4 = Lean toward B
5 = Mostly agree with B
6 = Fully agree with B
———————————————————
- When governments set rules for places like school sports, bathrooms, and other public spaces, which should be the priority?
A: Rules should be based on the sex people were assigned at birth.
B: Rules should be based on the gender that people identify with.
- When the government has to choose, which should be the priority?
A: Supporting global health programs and efforts to fight hunger and disease in poor countries.
B: Reducing humanitarian aid in other parts of the world and helping Americans instead.
- When the government has to choose, which should be the priority?
A: Banning parents from physically disciplining their children, such as spanking them.
B: The government should not be involved in how parents discipline their children, except in cases of abuse or neglect.
- When it comes to improving society, which statement comes closest to your view?
A: Play an active role in shaping the economy.
B: Take a limited role and rely more on businesses and markets.
- When the government has to choose, which should be the priority?
A: Reinforcing traditional family structures and distinct roles for men and women.
B: Challenging traditional gender roles and promoting equality across all genders.
- When the government has to choose, which should be the priority?
A: Maintaining law and order by restricting certain activities and behaviors.
B: Keeping society open and free by tolerating some disorder or disruption.
- When the government has to choose, which should be the priority?
A: The government should play a major role in helping people improve their financial situation.
B: People should mostly be responsible for improving their own financial situation, with limited government help.
- When the government has to choose, which should be the priority?
A: Protecting children’s privacy, even if it limits parental access to information.
B: Ensuring parents have full access to information about their children, even if it limits children’s privacy.
- When the government has to choose, which should be the priority?
A: Encouraging people to marry and start families.
B: Staying neutral on people’s life decisions.
- When the government has to choose, which should be the priority?
A: Setting rules to protect people from harmful choices, even if it limits personal freedom.
B: Letting people make their own choices, even if those choices risk harm.
- When it comes to refugees, which statement comes closest to your view?
A: The US has a responsibility to take in refugees from other countries.
B: The US isn’t obligated to take care of other countries’ citizens.
- When the government has to choose, which should be the priority?
A: Capping how much wealth any one person can have, so that no one has significantly more money than anyone else.
B: Ensuring people are free to grow and succeed financially, even if it means some accumulate far more wealth than others.
- When the government has to choose, which should be the priority?
A: Preventing fraud in government benefits programs, even if it means some eligible people are not approved.
B: Making sure everyone eligible for government benefits can receive them, even if there is some fraud.
- When the U.S. government has to decide its international role, which should be the priority?
A: Maintaining America’s leadership and engagement with the rest of the world.
B: Focusing less on world affairs and more on problems here at home.
- When it comes to economic development, which statement comes closest to your view?
A: Prioritize protecting the environment, even if it limits economic development and some business activity.
B: Prioritize economic development and business growth, even if it leads to negative environmental impacts.
- When the government has to choose, which should be the priority?
A: Preserving longstanding government institutions and making changes gradually.
B: Being willing to make major changes when government institutions aren’t working.